


Draft AC 61-16 v1.0 - Spin avoidance and stall recovery training


From a previous thread CASA opinion: Aircraft must be grounded in temps over 40 degrees I repeat the below in its entirety because the message needs to get out, if only CASA would learn it, an SR-22 T/O chart goes to 50�C and the DH-82 below to 45�C. Have made the chart large so those of us with less than perfect vision should have no trouble.
Perusing the old Digests kindly provided above in the forum, I came across this article in issue #33, which I reproduce in its entirety. Note density altitude is the focus, temp even goes to 45�C on the chart, and absolutely no mention of temp being a limit, just DA.
LIGHT AIRCRAFT TAKE-OFF PERFORMANCE
Temperature and Altitude Effects
A review of take-off accidents involving light aircraft has shown that an appreciable number of them can be attributed wholly or in part to a failure to allow for the effects of reduced air density arising from high temperature, high altitude, or, more particularly, from a combination of both.
Two separate effects must be considered;
(a) The effect of reduced air density on take-off
distance;
(b) the effect of reduced air density on climb
performance.
Both of these aspects will be examined in turn.
The Effect of Reduced Air Density on Take-off Distance
The normal takeoff consists of a full throttle run along the ground, a lift off at the take-off safety speed, and a climb away at this speed until a height of 50 feet is reached.
The take-off safety speed is defined as 1.2 Vs, where Vs is the power off stalling speed.
The indicated stalling speed of an aircraft depends, principally, on the aircraft’s weight, power setting and flap position. Changes in air density do not change the indicated air speed at the stall. Every pilot is aware, however, that under conditions of reduced air density the true air speed is greater than the indicated air speed; thus, in a take-off under high temperature conditions, the prescribed higher true air speed and the distance required to reach this speed will be greater. Alternatively, for a given take-off distance the gross weight of the aircraft and hence the take—off safety speed will have to be reduced in order to provide for a safe operation within the available distance.
Another major effect to be considered is the reduction of engine power output arising from reduced air density. In most light aircraft, take-off power is the full-throttle setting of its unsupercharged, or normally aspirated, engine. Changes in air density produce changes in the full throttle power of such engines. Any reduced air density means less air available for combustion and a fall-off in take-off power. The reduction in power is approximately proportional to the reduction in air density.* This reduction in available power means that less thrust will be available for accelerating or climbing the aircraft. lt can be seen, therefore, that reduced air density will not only demand longer take-off runs to allow the aircraft to accelerate to the higher true airspeeds but it also imposes the penalty of reducing the power available to achieve this acceleration. The take-off distances required are therefore greatly increased even for small reductions in air density.
The information provided in handbooks by the manufacturers of light aircraft is usually insufficient to take account of all the major variables and the Department of Civil Aviation has undertaken the production of the PL Charts (Performance Charts for Light Aircraft) to assist pilots in their calculations. For most aircraft types, the manufacturers data has been checked by flight testing in Australia and the chart data is based on these test results.
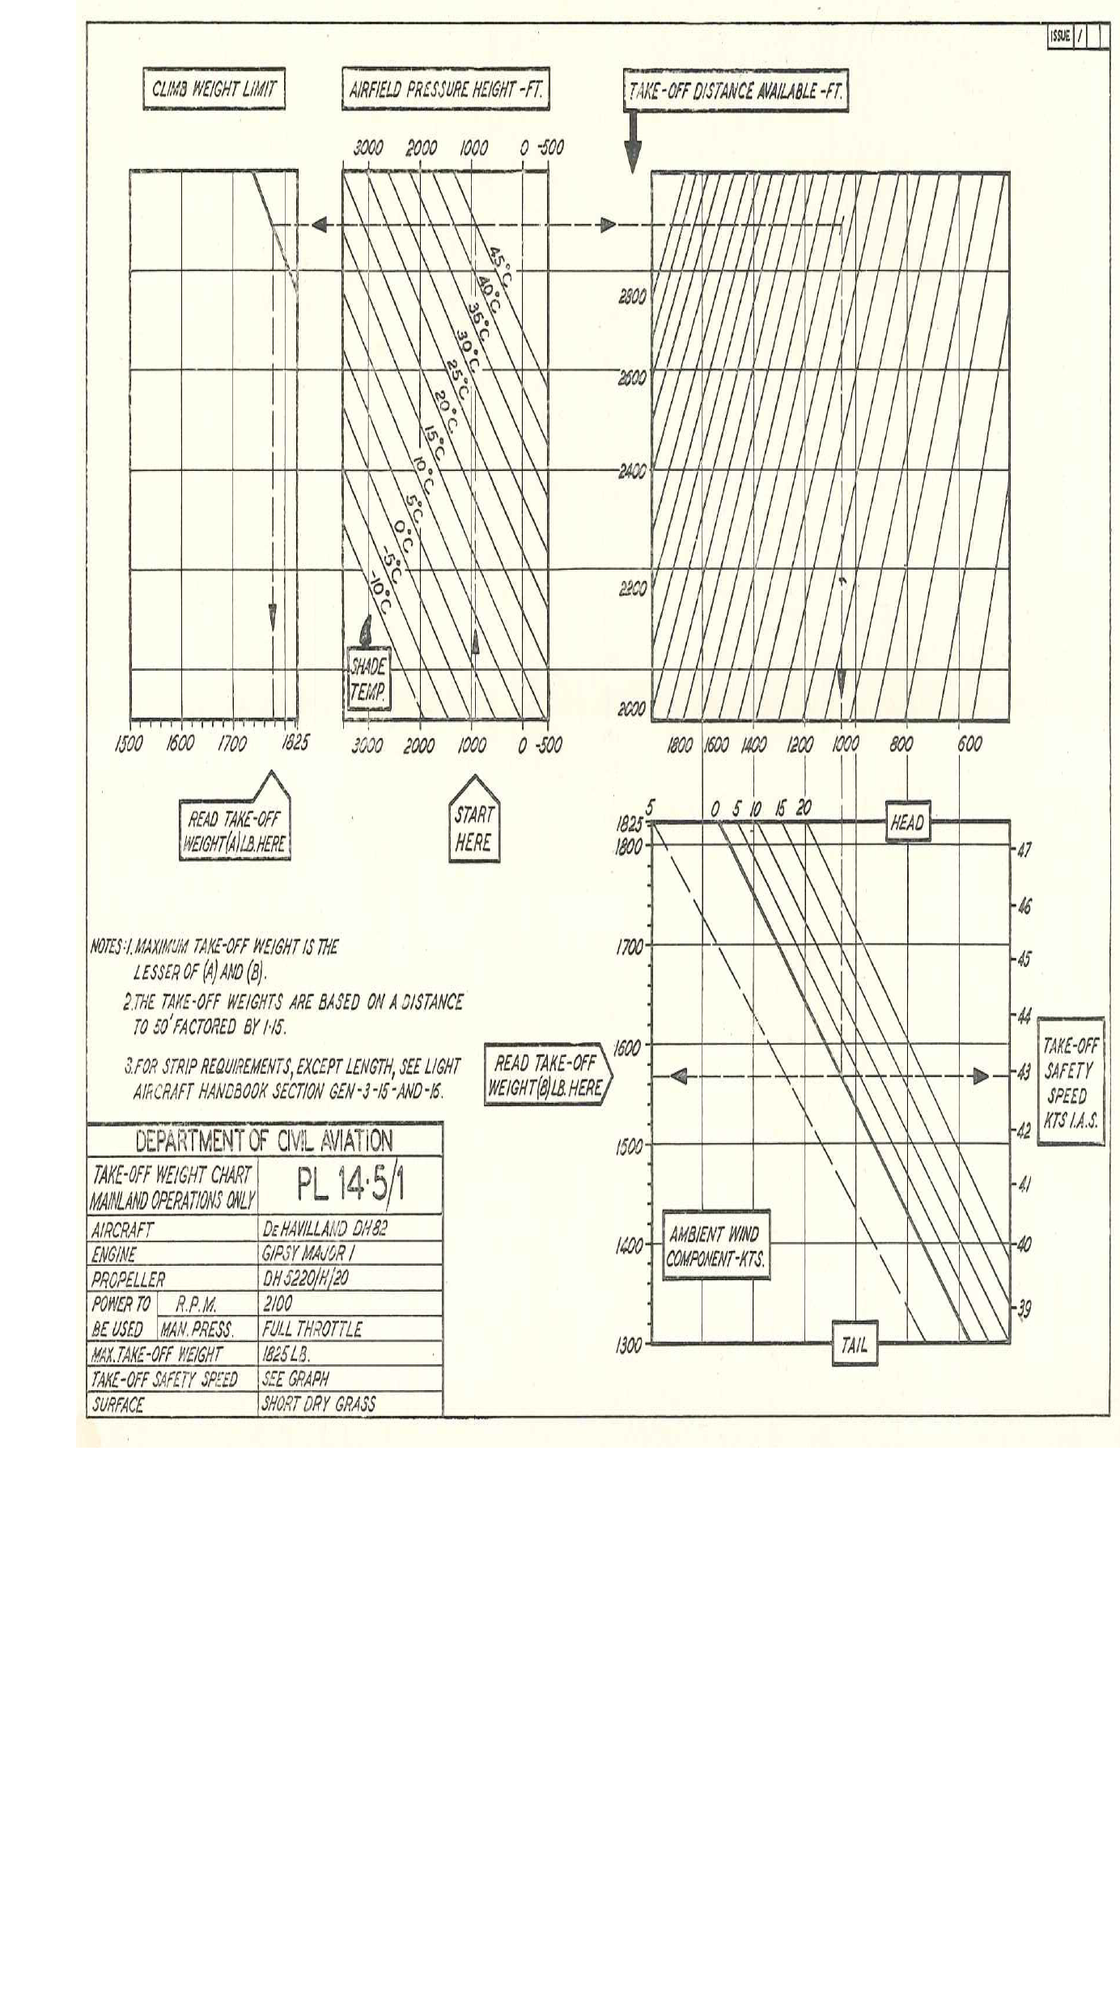
The chart indicates the maximum permissible gross weight for take-off after aerodrome pressure height, outside air temperature, take-off distance available and wind velocity are taken into account. Fifty per cent of the reported head wind component and 150 per cent of the reported tail wind component have been used in the construction of the chart and the take-off distance has been increased by a factor of 1.15 as is shown in the notes on the chart. The following example illustrated in the chart will show how the chart is used.
* In the case of a supercharged engine this effect is overcome, within limits, by compressing the air and thus restoring the air supply.
Airfield pressure height which may be read from your altimeter after setting 1,013.2 mb. = 920 feet
Outside air temperature measured in the shade : 113�F or 45�C
Take-off distance available = 1,550 feet
Wind velocity component = Nil
(1) Effect of Air Density Change
Enter the chart at �“START HERE" and find the intersection of the airfield pressure height (APH) and the outside air temperature (OAT). The point of intersection indicates the density height at which the next segment of the chart to the right should be entered. This density height is determined by the relationship of the APH/OAT intersection with the horizontal lines drawn through the upper three segments of the chart. The bottom line has a zero or standard sea level value as determined by the intersection of the zero airfield pressure and the standard 15�C temperature. Each successive line drawn is a 1,000 feet increment in density height. Thus it will be seen that the density height in this example is 4,500 foot which means that the density of the air under the conditions stated in the examples is the same as would exist at a height of 4,500 feet under conditions of standard atmosphere, At this point it is of interest to note the effect of temperature on density height. If the OAT had been 13‘”C the density height would have been the same as the airfield pressure height, i.e., 920 feet and, with an even lower temperature of 5�C (41�F) the equivalent of sea level standard conditions would prevail. It will become apparent from this why a light aircraft exhibits a lively performance on a frosty morning. Now move on to further corrections in the example.
(2) Effect of Take-off Distance Available
Move to the right on the chart until you intercept the line representing the take-off distance available and then move vertically downwards to the next correction.
It may be seen that, in the particular conditions of this take-off, no reduction of the maximum permissible gross weight would have been necessary had the available length of run been equal to or greater than 2,400 feet. Since the available length is only 1,550 feet, however, it is immediately apparent that the gross weight for take-off will need to be reduced.
(3) Effect of Wind
Continue to move vertically downwards to intercept the ambient wind velocity Line and then move horizontally to the left and read from the scale the maximum take-off weight permitted under these circumstances, i.e., 1.570 lb.
(4) Take-off Safety Speed
Since the stalling speed varies directly with weight, the take-off safety speed will also vary directly with the take-off weight and for this case it may be read directly off the right hand side of the diagram as 43 Kts. I.A.S.
We are now in a position to see that under the conditions prescribed, the combined effects of limited take-off distance available and the reduced air density has demanded a reduction in the maximum permissible take-otf weight from 1,825 lb. to 1,570 lb.
The Effect of Reduced Density on Climb Performance
The Australian performance standards require that all light aircraft have a minimum gradient of climb after take-off of six per cent, This can be expressed as 6 feet of climb for every 100 feet of horizontal travel along the flight path, or 365 feet per nautical mile which is equivalent to a rate of climb of 365 feet per minute if the aircraft’s climbing speed is 60 knots (T.A.S.).
The climb gradient is greatly affected by even a small reduction of engine power because the power available to climb the aircraft is only the power in excess of that required for straight and level flight at the climbing speed.
We have already pointed out that any reduction in air density produces a proportionate reduction in engine power. Reference to atmosphere tables will show that air density falls about 3 per cent per 1,000 feet between sea level and 3.000 feet, reducing to 2 per cent per 1,000 feet at 16,000 feet. Thus it the aircraft is taking off in conditions of pressure and temperature which are equivalent to a height of 4,500 feet under standard conditions (i.e., a density height of 4,500 feet) the engine output under full throttle at constant r.p.m. will fall about 13 per cent. This amounts to a considerable reduction in the power available for the climb and the gradient of climb is correspondingly reduced. If the density is reduced to a point where the minimum climb gradient would not be achieved, the take-off gross weight must be reduced in order to restore the gradient and thus ensure a safe climb out over obstacles.
To show how this adjustment is calculated we must now refer to the Climb Weight Limit diagram in the PL Chart.
Climb Weight Limit
Enter the chart at the airfield pressure height and move vertically until the line intercepts the outside air temperature. Then move horizontally to the left to the point of intersection with the sloping reference line and then vertically downwards to the gross weight scale where it can be seen that the climb weight limit is 1,775 lb.
Points to be Especially Noted
The maximum permissible weight derived from our previous calculations based on runway length available was 1,570 lb., Whilst the weight limitation based on the climb requirements is 1,775 lb. The lesser of these two is the maximum permissible take-off gross weight, i.e., 1,570 lb.
If the aircraft's gross weight is held constant the effect of temperature on the length required for take-off at a particular aerodrome may be seen from the chart. Referring to our example again, you will remember that 1,550 feet was the minimum length required to lift 1,570 lb. when the temperature was 45�C (113"F). Drop the temperature to 13�C (55�F), which is standard for a pressure height of 920 feet, and for the same weight the take-oil length required is reduced to 1,170 feet. Check this on the chart at the point where a density height of 920 feet intercepts the vertical line of our example in the ‘distance available" segment of the chart.
Whenever a take-off in the type of aircraft to which the sample chart applies is to be carried out with a density height exceeding 3,800 feet, Some reduction of take-off (i.e., 1,825 lb.) must be made irrespective of the length of run available. This arises from the climb weight limitations of the aircraft.
Example:
Now try this example yourself using a ruler and sharp pencil.
Airfield Pressure Height ....,. . ,.... 1.500 feet
Outside Air Temperature ..,... . ..... 25�C
Take—off distance available . .... 1,900 feet
Head Wind Component 5 m.p.h.
It you have mastered the system you will agree that the take—off gross weight is 1,785 lb. and the take-off safety speed is 47 knots.
An answer from the horses mouth so to speak. I asked Cessna, Wichita, the following
Is the same principal of using the density altitude to calculate take off distance when temperatures are above 40�C permissible, or is 40�C considered an operating limit for the singles (172, 207 etc)?
A view, which has currency in the community, is that you may not take off if the temperature is over 40�C.
Their reply
Perusing the old Digests kindly provided above in the forum, I came across this article in issue #33, which I reproduce in its entirety. Note density altitude is the focus, temp even goes to 45�C on the chart, and absolutely no mention of temp being a limit, just DA.
LIGHT AIRCRAFT TAKE-OFF PERFORMANCE
Temperature and Altitude Effects
A review of take-off accidents involving light aircraft has shown that an appreciable number of them can be attributed wholly or in part to a failure to allow for the effects of reduced air density arising from high temperature, high altitude, or, more particularly, from a combination of both.
Two separate effects must be considered;
(a) The effect of reduced air density on take-off
distance;
(b) the effect of reduced air density on climb
performance.
Both of these aspects will be examined in turn.
The Effect of Reduced Air Density on Take-off Distance
The normal takeoff consists of a full throttle run along the ground, a lift off at the take-off safety speed, and a climb away at this speed until a height of 50 feet is reached.
The take-off safety speed is defined as 1.2 Vs, where Vs is the power off stalling speed.
The indicated stalling speed of an aircraft depends, principally, on the aircraft’s weight, power setting and flap position. Changes in air density do not change the indicated air speed at the stall. Every pilot is aware, however, that under conditions of reduced air density the true air speed is greater than the indicated air speed; thus, in a take-off under high temperature conditions, the prescribed higher true air speed and the distance required to reach this speed will be greater. Alternatively, for a given take-off distance the gross weight of the aircraft and hence the take—off safety speed will have to be reduced in order to provide for a safe operation within the available distance.
Another major effect to be considered is the reduction of engine power output arising from reduced air density. In most light aircraft, take-off power is the full-throttle setting of its unsupercharged, or normally aspirated, engine. Changes in air density produce changes in the full throttle power of such engines. Any reduced air density means less air available for combustion and a fall-off in take-off power. The reduction in power is approximately proportional to the reduction in air density.* This reduction in available power means that less thrust will be available for accelerating or climbing the aircraft. lt can be seen, therefore, that reduced air density will not only demand longer take-off runs to allow the aircraft to accelerate to the higher true airspeeds but it also imposes the penalty of reducing the power available to achieve this acceleration. The take-off distances required are therefore greatly increased even for small reductions in air density.
The information provided in handbooks by the manufacturers of light aircraft is usually insufficient to take account of all the major variables and the Department of Civil Aviation has undertaken the production of the PL Charts (Performance Charts for Light Aircraft) to assist pilots in their calculations. For most aircraft types, the manufacturers data has been checked by flight testing in Australia and the chart data is based on these test results.
The chart indicates the maximum permissible gross weight for take-off after aerodrome pressure height, outside air temperature, take-off distance available and wind velocity are taken into account. Fifty per cent of the reported head wind component and 150 per cent of the reported tail wind component have been used in the construction of the chart and the take-off distance has been increased by a factor of 1.15 as is shown in the notes on the chart. The following example illustrated in the chart will show how the chart is used.
* In the case of a supercharged engine this effect is overcome, within limits, by compressing the air and thus restoring the air supply.
Airfield pressure height which may be read from your altimeter after setting 1,013.2 mb. = 920 feet
Outside air temperature measured in the shade : 113�F or 45�C
Take-off distance available = 1,550 feet
Wind velocity component = Nil
(1) Effect of Air Density Change
Enter the chart at �“START HERE" and find the intersection of the airfield pressure height (APH) and the outside air temperature (OAT). The point of intersection indicates the density height at which the next segment of the chart to the right should be entered. This density height is determined by the relationship of the APH/OAT intersection with the horizontal lines drawn through the upper three segments of the chart. The bottom line has a zero or standard sea level value as determined by the intersection of the zero airfield pressure and the standard 15�C temperature. Each successive line drawn is a 1,000 feet increment in density height. Thus it will be seen that the density height in this example is 4,500 foot which means that the density of the air under the conditions stated in the examples is the same as would exist at a height of 4,500 feet under conditions of standard atmosphere, At this point it is of interest to note the effect of temperature on density height. If the OAT had been 13‘”C the density height would have been the same as the airfield pressure height, i.e., 920 feet and, with an even lower temperature of 5�C (41�F) the equivalent of sea level standard conditions would prevail. It will become apparent from this why a light aircraft exhibits a lively performance on a frosty morning. Now move on to further corrections in the example.
(2) Effect of Take-off Distance Available
Move to the right on the chart until you intercept the line representing the take-off distance available and then move vertically downwards to the next correction.
It may be seen that, in the particular conditions of this take-off, no reduction of the maximum permissible gross weight would have been necessary had the available length of run been equal to or greater than 2,400 feet. Since the available length is only 1,550 feet, however, it is immediately apparent that the gross weight for take-off will need to be reduced.
(3) Effect of Wind
Continue to move vertically downwards to intercept the ambient wind velocity Line and then move horizontally to the left and read from the scale the maximum take-off weight permitted under these circumstances, i.e., 1.570 lb.
(4) Take-off Safety Speed
Since the stalling speed varies directly with weight, the take-off safety speed will also vary directly with the take-off weight and for this case it may be read directly off the right hand side of the diagram as 43 Kts. I.A.S.
We are now in a position to see that under the conditions prescribed, the combined effects of limited take-off distance available and the reduced air density has demanded a reduction in the maximum permissible take-otf weight from 1,825 lb. to 1,570 lb.
The Effect of Reduced Density on Climb Performance
The Australian performance standards require that all light aircraft have a minimum gradient of climb after take-off of six per cent, This can be expressed as 6 feet of climb for every 100 feet of horizontal travel along the flight path, or 365 feet per nautical mile which is equivalent to a rate of climb of 365 feet per minute if the aircraft’s climbing speed is 60 knots (T.A.S.).
The climb gradient is greatly affected by even a small reduction of engine power because the power available to climb the aircraft is only the power in excess of that required for straight and level flight at the climbing speed.
We have already pointed out that any reduction in air density produces a proportionate reduction in engine power. Reference to atmosphere tables will show that air density falls about 3 per cent per 1,000 feet between sea level and 3.000 feet, reducing to 2 per cent per 1,000 feet at 16,000 feet. Thus it the aircraft is taking off in conditions of pressure and temperature which are equivalent to a height of 4,500 feet under standard conditions (i.e., a density height of 4,500 feet) the engine output under full throttle at constant r.p.m. will fall about 13 per cent. This amounts to a considerable reduction in the power available for the climb and the gradient of climb is correspondingly reduced. If the density is reduced to a point where the minimum climb gradient would not be achieved, the take-off gross weight must be reduced in order to restore the gradient and thus ensure a safe climb out over obstacles.
To show how this adjustment is calculated we must now refer to the Climb Weight Limit diagram in the PL Chart.
Climb Weight Limit
Enter the chart at the airfield pressure height and move vertically until the line intercepts the outside air temperature. Then move horizontally to the left to the point of intersection with the sloping reference line and then vertically downwards to the gross weight scale where it can be seen that the climb weight limit is 1,775 lb.
Points to be Especially Noted
The maximum permissible weight derived from our previous calculations based on runway length available was 1,570 lb., Whilst the weight limitation based on the climb requirements is 1,775 lb. The lesser of these two is the maximum permissible take-off gross weight, i.e., 1,570 lb.
If the aircraft's gross weight is held constant the effect of temperature on the length required for take-off at a particular aerodrome may be seen from the chart. Referring to our example again, you will remember that 1,550 feet was the minimum length required to lift 1,570 lb. when the temperature was 45�C (113"F). Drop the temperature to 13�C (55�F), which is standard for a pressure height of 920 feet, and for the same weight the take-oil length required is reduced to 1,170 feet. Check this on the chart at the point where a density height of 920 feet intercepts the vertical line of our example in the ‘distance available" segment of the chart.
Whenever a take-off in the type of aircraft to which the sample chart applies is to be carried out with a density height exceeding 3,800 feet, Some reduction of take-off (i.e., 1,825 lb.) must be made irrespective of the length of run available. This arises from the climb weight limitations of the aircraft.
Example:
Now try this example yourself using a ruler and sharp pencil.
Airfield Pressure Height ....,. . ,.... 1.500 feet
Outside Air Temperature ..,... . ..... 25�C
Take—off distance available . .... 1,900 feet
Head Wind Component 5 m.p.h.
It you have mastered the system you will agree that the take—off gross weight is 1,785 lb. and the take-off safety speed is 47 knots.
An answer from the horses mouth so to speak. I asked Cessna, Wichita, the following
There is an argument in the community here as to whether the 40�C on the take off charts is a limit, or not.
ie: is take off permissible at temperatures in excess of 40�C.
I note in the 404 manual, dual and single engine, climb charts are provided for temperatures up to 50�C.
Do you consider the following an acceptable means of flight planning on the 404 when temperatures are in excess of 40�C and up to 50�C?
1. Determine from the climb charts the regulatory stipulated gradient.
2. Calculate the density altitude.
3. Determine from the take off chart a temperature and pressure altitude that gives the same density altitude.
For example, 50�C at zero pressure altitude the density altitude is 4,158 feet.
Entering the take off chart 1,000 feet pressure altitude at 40�C will give a density altitude of 4,210 feet.
4. Use the 1,000 feet PA, 40�C take off distance.
A view, which has currency in the community, is that you may not take off if the temperature is over 40�C.
Their reply
The temperatures on the performance charts are provided to cover the majority of average operations. The temperature limits of these charts were not intended as a limitation for the aircraft, but simply what the aircraft was tested to. Simple interpolation as you have performed is appropriate.

Join Date: Feb 2015
Location: Melbourne
Posts: 215
Likes: 0
Received 0 Likes
on
0 Posts
Thanks Megan (and Clare) for highlighting the stupidity of that letter above #31. This is what happens when the career bureaucrats and legal boffins are put in charge, most of which haven't flown anything more complex than a kite at the local park. No understanding of the technicalities or practicalities of the industry they are supposed to be overseeing. No wonder the regulatory reform process is such a mess. Lead Balloon says laughable..? More like embarrassing I'd say..!
A similar issue revolves around "demonstrated" crosswind values published in AFM's that sometimes includes the statement "not considered a limitation". If the aircraft has a demonstrated crosswind value of 15kts (with the statement that this value is not considered a limitation) & you run off the runway & severely damage the aircraft, where do you stand from an insurance perspective? If the crosswind was 17kts, you may be OK, but if it was 30kts, you may not be. The only way you can be reasonably certain of insurance coverage is to stick with the manufacturer's demonstrated values in my opinion, but this argument has been ongoing for a long time...
What was the job description of the person who wrote that letter?
I have had letters from FOIs and AWIs who don't know what Day VFR means, don't know what AWK on an maintenance release means, who invent Air Operators Certificates that don't exist and the threaten to audit you because of your bad attitude when you try, in vain, to explain the difference between an Air Operator Certificate holder and a Registered Operator of an aircraft and tell them you don't actually have an AOC; can't even get the right job description for their colleagues, calling people from the FTTE "FOIs" and pretending they have all kinds of powers and knowledge that they simply don't have.
In response to any letter like that I would be straight on to the phone to their team manager, not take much notice of a lowly jobsworth inspector.
.. I repeat the below in its entirety because the message needs to get out, if only CASA would learn it, an SR-22 T/O chart goes to 50�C and the DH-82 below to 45�C. Have made the chart large so those of us with less than perfect vision should have no trouble.
Perusing the old Digests kindly provided above in the forum, I came across this article in issue #33, which I reproduce in its entirety. Note density altitude is the focus, temp even goes to 45�C on the chart, and absolutely no mention of temp being a limit, just DA.
Perusing the old Digests kindly provided above in the forum, I came across this article in issue #33, which I reproduce in its entirety. Note density altitude is the focus, temp even goes to 45�C on the chart, and absolutely no mention of temp being a limit, just DA.
With Part 91 next year I am required to check the take-off performance for every flight and I must use information from the AFM, manufacturer�s manual or other approved data. We will not be able to use those old �P� charts as they are not approved. I only have approved data for a level sealed runway so unable to operate off a grass strip � many airplanes will run across that limitation.
Finally, it is worth noting that with FAR 23 for small airplanes there is nil requirement for any performance limitations and any operating limitations MUST be specified in the airplane flight manual (look in the limitations section).
And yet those old so-called Cessna charts with the boxes (Cessna actually use tables) are still in the PPL exam, apparently
Join Date: Apr 2019
Location: Australia
Posts: 358
Likes: 0
Received 0 Likes
on
0 Posts
https://www.casa.gov.au/sites/defaul...e-workbook.pdf
The take off and landing distance charts certainly are included in the PPL exam work book (link to work book below). Cessna may not use these charts but certainly some other manufacturers do (e.g. Piper).
https://www.casa.gov.au/sites/defaul...e-workbook.pdf
https://www.casa.gov.au/sites/defaul...e-workbook.pdf
So, when a student goes off to a grass runway (perhaps with a bit of slope) to do the short field takeoff and landing for the PPL flight test - and as part of the test demonstrated determination of the distance required - where did that student get the takeoff and landing distances for a PA-28 on a grass runway? What will the Flight Examiner say about it, especially once Part 91 comes into effect?
The PA-28 manual states "Effects of conditions not considered on the charts must be evaluated by the pilot, such as the effect of
soft or grass runway surface on takeoff and landing performance,"
At least the tables in the Cessna manual state to increase the distance by 15% of the ground roll figure for takeoff on grass. For landing increase the distance by 45% of the ground roll figure. They're effectively just using the same information as the UK CAA in their https://publicapps.caa.co.uk/modalap...detail&id=1913
There is a big disconnect between pilot theory training, what CASA thinks and real aircraft operation.
Last edited by djpil; 4th Feb 2020 at 20:04. Reason: added note from PA-28 manual
The following users liked this post:
The regulatory reform program.. Laughable? Embarassing? Disgusting, Yes and many other words to describe what Governments of all persuasions have let happen to let rot away an industry so vtal for this country.
A cast of 1000s, costs of billions and GA fcuked. The lucky country, my arse.
A cast of 1000s, costs of billions and GA fcuked. The lucky country, my arse.
I have had letters from FOIs and AWIs who don't know what Day VFR means, don't know what AWK on an maintenance release means, who invent Air Operators Certificates that don't exist and the threaten to audit you because of your bad attitude when you try, in vain, to explain the difference between an Air Operator Certificate holder and a Registered Operator of an aircraft and tell them you don't actually have an AOC; can't even get the right job description for their colleagues, calling people from the FTTE "FOIs" and pretending they have all kinds of powers and knowledge that they simply don't have.
Last edited by Lead Balloon; 5th Feb 2020 at 01:52.
Whilst the subject of 'P' charts is s slight digression from thread topic. I'll throw in my two bits worth, based upon operational experience.
Slope limits is generally presented as +/- 2%; this being a typical day to day requirement. OEM electronic performance data, for biz jet aircraft will calculate within those parameters. So is Ops outside of +/- 2% not permitted? Absolutely not! The manufacturer has not tested the aircraft outside of +/- 2%. Special charts may be made available by request.
Answer is very simple; clear the individual runways with your insurance underwriter.
Scenario? Goroka in PNG, good slope, outside of 'slope' performace data, but the final acceptance is that the airfield is used by Fokker 70/100, Dash 8's of various models, previously Fokker F28 and even Fokker 27/50, turbo props. In my case the Underwriter was happy with the assessment as being 'sound' and CASA even accepted the argument as being sound (in writing) All take-off at Goroka are downhill, landings are all uphill.
Are you completely insane? That’s like taking off with a 20kt headwind when the charts only go to 15!
They don't realise how the network functions and that we can easily find out their history before they entered the sheltered workshop. Also that trying to encourage industry people to become "part of the team" isn't going to work when it would mean sharing an office with these drongoes, despite the bloated salary package.
I will say there are some really good people in CASA who chose to leave the industry rather than being pushed but they are the minority...and some of them do come back to GA.
Join Date: Apr 2019
Location: Australia
Posts: 358
Likes: 0
Received 0 Likes
on
0 Posts
https://en.m.wikipedia.org/wiki/The_Lucky_Country
Sticks yre right of course. And I even have Donald Horne's ? book somewhere.
Compared to most of the world we are very, very lucky indeed.
But in our laid back , 'she'll be right' attitudes, bureaucraczies feel free to grow like Topsy and bugger things in their bloated processes. So all is ;not right'
eg... as with CAsA...the aviation industry and GA is very unlucky.
Its a worry
