


Reduction of BOM Services A100+

Thread Starter
Reduction of BOM Services A100+
Hi All,
I've noticed now that all Arfors no longer deal with anything above 10,000ft, where do we now go to for that information?
I called BOM today to ask about it and was given a wishy washy answer about "Major Restructuring" and changing to a more "Graphical Display" or some crud. It came about after looking at a flight I was about to take I was considering weather and the fact that I might need to try and climb above it, along this line of thought I needed to know the Freezing Level to assess my options but low and behold all it states now is "Above 10,000ft".
I was directed to the "Chart Directory" of naips to find this information now but I have to admit I have never been into this area and have no idea which of the dozens of charts I should be looking at for this information!
Can anyone explain why this has happened and is there somewhere we can find this information now? For instance the Freezing Level for an area and what the cloud types and levels are meant to be above 10,000ft. I should probably know where to find this info but have probably forgotten it after using Arfors for the better part of the last decade and never using whatever the other way would be!!

Join Date: Nov 2010
Location: Australia
Posts: 18
Likes: 0
Received 0 Likes
on
0 Posts
Changes to AIRMET, SIGMETs and ARFORs from the 10th November 2016
Google "changes to ARFOR" and the following is in the second result...
From the 10th November 2016, the vertical extent of ARFORs and AIRMETs will be reduced to 10,000 feet above mean sea level (currently FL200). Weather information for airspace above 10,000 feet can be obtained from Medium and High Level Significant Weather (SIGWX) charts, Grid Point Wind and Temperature (GPWT) charts and the NAIPS Wind/Temperature Profile.
From the 10th November 2016, the vertical extent of ARFORs and AIRMETs will be reduced to 10,000 feet above mean sea level (currently FL200). Weather information for airspace above 10,000 feet can be obtained from Medium and High Level Significant Weather (SIGWX) charts, Grid Point Wind and Temperature (GPWT) charts and the NAIPS Wind/Temperature Profile.
Thread Starter
Thanks GoDot, As I said I know they now only go to 10,000feet and as I said I'm aware of the Charts available.
Cheers fujii, that was a bit more helpful, I should have just one back to the AIP for some help in decoding the charts. "Re-Discovered" that the freezing levels are on the Mid-Level SIGWX charts, they have the lines showing where freezing level is at 10,000ft and where it's 15,000ft and of course the GPWT charts which will be tons of fun to spend extra time decoding and figuring out the freezing level instead of just having it handy on the ArFor!!
Out of curiosity, does anyone have a quicker way of being able to find the Freezing Levels for areas that they use? For instance let's say I'm doing a flight from Gold Coast to Launceston, it used to be very simple to pull up the Arfors along the route and see the Freezing Levels, now I have to get the GPWT chart (Which they don't even orientate properly but require you to open it again in another window and rotate yourself?!) and work out along each and every grid along the way what it will be?! Or just use the SIGWX and attempt to extrapolate along the way between the 10,000ft and 15,000ft lines? Surely someone has a neat trick to make this quicker and easier?
Join Date: Sep 2007
Location: Aus
Posts: 39
Likes: 0
Received 0 Likes
on
0 Posts
Ixixly,
Try the SPFIB, it'll give you route specific winds, area forecasts, and relevant aerodromes all in one hit. It might take a bit of setting up, but you can save your regular routes, then it's just a matter of entering time and date for each departure.
Try the SPFIB, it'll give you route specific winds, area forecasts, and relevant aerodromes all in one hit. It might take a bit of setting up, but you can save your regular routes, then it's just a matter of entering time and date for each departure.
Join Date: Jul 2010
Location: sydney
Posts: 1,469
Likes: 0
Received 0 Likes
on
0 Posts
ixixly,
many moons ago walked into the FS at Mount Hagen in PNG and asked for weather for "Mosby".
Local FS officer said not a word, picked up clipboard and went out the back door.
Puzzled I followed.
He was standing there looking up in the direction of "Mosby" writing his "Forecast" on the clipboard pad.
Maybe BOM is cutting costs by revisiting the past?
CAsA employ an expert in PNG VooDoo to produce our world leading regulations.
Why not BOM employing someone to cast the bones or rummage the chicken entrails for forecasting?
The changes in ARFOR have come about largely because of the Mildura fog incident.
The weather forecasting system was subject to reviews as a result, and one of the main discussion points was that ARFORs which service a small percentage of the aviation community are the most expensive and time consuming to produce. It might take 3 hours to produce a complicated ARFOR, in which time the same person could have generated 30 TAFs.
The upshot was that by making ARFORs simpler for BOM to produce, more time could be spent on getting the TAFs right for major aerodromes.
Probably a win if you fly around in a transport gig, not so good if you're a GA or private operator who relies on ARFOR.
I'd say it's probably a step in the right direction if so much resource was being spent on such a small market, but given some of the TAFs I've seen since 20 November, I wonder exactly where the increased forecasting resources are being directed.
Thread Starter
Thanks Slippery Pete, that makes a lot of sense. I guess I'd always assumed that most of that sort of thing was automated these days, I'm not entirely convinced by reducing the area from 20,000ft to 10,000ft it would really save them that much time but it sounds like you're in the know.
It seems though that whilst we might represent a small percentage of the aviation community but are the ones most in need of such services as we don't have large flight planning departments behind us.
I'd also be interested in seeing where these extra resources have been diverted to and am surprised that a bigger deal hasn't been made out of this, considering it's a reduction in services. Although TAFs are generally more useful in terms of safety and increasing their accuracy and hopefully their frequency would be very useful it seems like that hasn't really happened and that overall they've just done this as a cost cutting measure. I'm still seeing Prob 30s that never come about, which are issued in the morning with no adjustments made throughout the day at all to common locations which makes me feel like the TAFs frequency and accuracy have still not been increased or improved.
Out of curiosity, does anyone have a quicker way of being able to find the Freezing Levels for areas that they use? For instance let's say I'm doing a flight from Gold Coast to Launceston, it used to be very simple to pull up the Arfors along the route and see the Freezing Levels, now I have to get the GPWT chart (Which they don't even orientate properly but require you to open it again in another window and rotate yourself?!) and work out along each and every grid along the way what it will be?! Or just use the SIGWX and attempt to extrapolate along the way between the 10,000ft and 15,000ft lines? Surely someone has a neat trick to make this quicker and easier?
Thread Starter
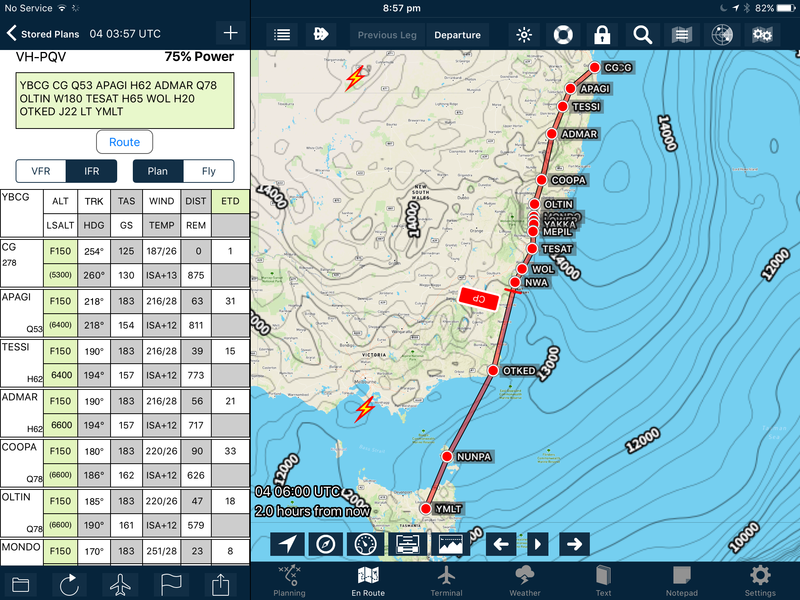
Bevan666, I'm actually an Ozrunways user myself as I've had issues with Avplan in the past and my current company only mentions use of Ozrunways and Jepps in our Ops manual as well. Generally this sort of information is an overlay that is grabbed from somewhere else, I'll have a dig around but does anyone know where Avplan get this overlay information from as it's exactly what I'm looking for!
Join Date: Nov 2003
Location: Tasmania and High Wollemi
Posts: 439
Received 0 Likes
on
0 Posts
this works for me. format a bit chopped up from the copy and paste. N0180
0623 UTC 04/12/16 AIRSERVICES AUSTRALIA
WIND/TEMPERATURE PROFILE
VALID FROM 0623 UTC DEC 04, 2016 TO 1500 UTC DEC 04, 2016
ROUTE WIND CROSS-SECTION (DERIVED FROM GRIB UPPER WINDS DATA)
-------------------------------------------------------------
TRK(TRUE) DIST ALT DIR SPD COMP XTRK OAT ISA
YBBN WIZZA 192 0018 445 232 026 -020 -017 -68 -12
385 197 020 -020 -002 -59 -03
340 212 028 -026 -010 -47 +06
300 212 034 -032 -012 -36 +08
265 209 027 -026 -008 -19 +12
185 191 026 -026 +000 -08 +14
140 194 025 -025 -001 +00 +13
100 210 013 -012 -004 +09 +14
050 300 005 +002 -005 +20 +15
WIZZA ADMAR 200 0169 445 230 035 -030 -018 -69 -13
385 198 022 -022 +001 -59 -03
340 221 031 -029 -011 -47 +05
300 216 041 -040 -011 -36 +09
265 219 029 -027 -009 -20 +12
185 206 022 -022 -002 -08 +13
140 205 022 -022 -002 +00 +13
100 230 013 -011 -006 +09 +13
050 327 002 +001 -001 +22 +16
ADMAR COOPA 192 0090 445 239 047 -032 -035 -69 -13
385 237 033 -024 -023 -59 -03
340 231 042 -033 -026 -47 +05
300 224 049 -042 -026 -36 +08
265 239 034 -023 -025 -20 +12
185 236 019 -014 -013 -09 +12
140 227 020 -016 -011 -00 +13
100 230 014 -011 -008 +08 +13
050 224 003 -002 -001 +22 +17
COOPA OLTIN 197 0047 445 241 051 -037 -036 -69 -13
385 246 041 -027 -031 -59 -03
340 232 050 -041 -028 -47 +05
300 231 054 -045 -030 -36 +08
265 247 037 -023 -028 -20 +11
185 251 023 -014 -019 -09 +12
or
0629 UTC 04/12/16 AIRSERVICES AUSTRALIA
WIND/TEMPERATURE PROFILE
VALID FROM 0629 UTC DEC 04, 2016 TO 1500 UTC DEC 04, 2016
ROUTE WIND CROSS-SECTION (DERIVED FROM GRIB UPPER WINDS DATA)
-------------------------------------------------------------
(TRUE) DIST ALT DIR SPD COMP XTRK OAT ISA
YBCG YMLT 199 0859 445 248 053 -035 -040 -67 -11
385 252 054 -033 -043 -60 -03
340 252 056 -034 -045 -48 +05
300 251 056 -035 -044 -37 +08
265 259 039 -020 -034 -21 +10
185 260 026 -013 -023 -10 +11
140 257 027 -015 -023 -02 +11
100 258 025 -013 -021 +06 +11
050 310 009 +003 -009 +19 +13
Storms (isolated but very strong radar returns) approaching Adelaide at the moment from NW.
Southern most line will miss the airport, but more northern one is tracking straight for YPAD and are probably an hour to 90 mins away.
TTF says CAVOK. No inter. NOTHING.
Hellooooo ... BoM? Anyone there?
Southern most line will miss the airport, but more northern one is tracking straight for YPAD and are probably an hour to 90 mins away.
TTF says CAVOK. No inter. NOTHING.
Hellooooo ... BoM? Anyone there?
