.
Ouuuufffff,
This was a lot more work than I originally expected, but a great learning experience in digitizing, curve fitting, interpolation, plotting software, etc.....
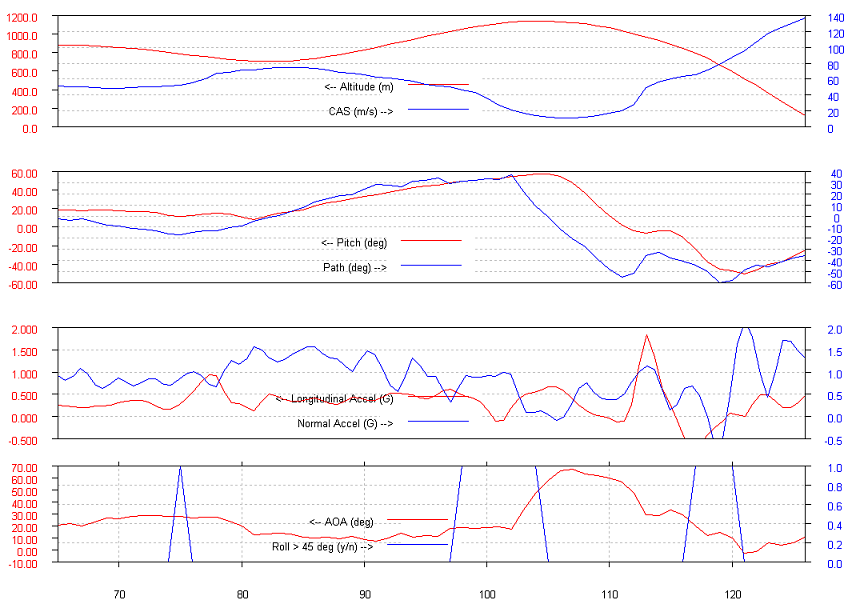
The following graph is derived from only the DFDR data from the preliminary report, more specifically from the Altitude, CAS, and pitch vs time.
The data is really good except for Altitude. It seems that the altitude is not recorded at exactly every second, but instead at 2 rates, and does not seem to be corrected in the altitude data of the prelim report. This reveals itself more during the fast climbs and descents, e.g. in the last 20 secs. Does someone have any idea why this is ?
Therefore, a minimum of filtering was done to the altitude data. The worst affected is G normal. Others much less.
My main original intent was to try this experiment and to obtain the normal G acceleration near the end of the flight which is 1.3 G here. I believe that from the pitch change rate that this results in approx 3 G. I believe this method is usually used from a 1 G starting point. Anybody have and comments about the later method of obtaining G load ?
.