Originally Posted by
CodyBlade
Must interpret the graphs with some common sense eh.
Is this ridicule?
I can't quite tell, please elaborate!
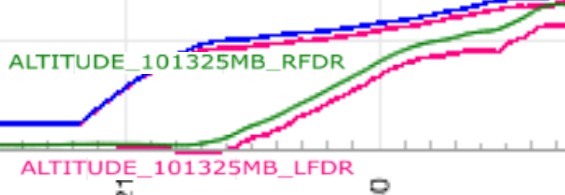
Anyway i've enlarged the Lion Air 610 FDR graph a bit so maybe you can see it as well.
The dip in this image is about 100 to 150 ft, comparable to the dip on rotation we see in the ADS-B data from the Ethiopian flight.
It is only present for the left altitude readout, which was corrected by the faulty left AoA.
FDR graph magnificiation take from preliminary Lion Air 610 report: