Edinburgh eating Glasgow for decades
More fun with Excel, getting v rusty.
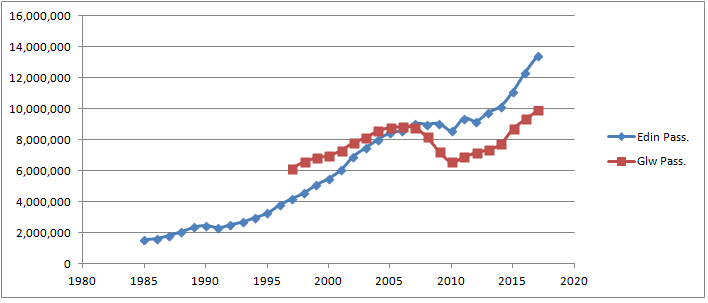
Year Edin Pass. Glw Pass.
1985 1,578,000
1986 1,651,000
1987 1,852,000
1988 2,080,000
1989 2,369,000
1990 2,495,000
1991 2,343,000
1992 2,539,000
1993 2,721,000
1994 3,001,000
1995 3,280,000
1996 3,810,000
1997 4,214,919 6,117,006
1998 4,588,507 6,566,927
1999 5,119,258 6,813,955
2000 5,519,372 6,965,500
2001 6,067,333 7,292,327
2002 6,930,649 7,803,627
2003 7,481,454 8,129,713
2004 8,017,547 8,575,039
2005 8,456,739 8,792,915
2006 8,611,345 8,848,755
2007 9,047,558 8,795,653
2008 9,006,702 8,178,891
2009 9,049,355 7,225,021
2010 8,596,715 6,548,865
2011 9,385,245 6,880,217
2012 9,195,061 7,157,859
2013 9,775,443 7,363,764
2014 10,160,004 7,715,988
2015 11,114,587 8,714,307
2016 12,348,425 9,327,193
2017 13,410,256 9,902,239
From -
https://en.wikipedia.org/wiki/Edinbu...senger_Numbers
https://en.wikipedia.org/wiki/Glasgo...l_traffic_data
Last edited by jimjim1; 8th Sep 2018 at 21:19.