


Digitizing Performance Graphs

Thread Starter
Joined: Jul 2015
Posts: 45
Likes: 0
From: NZ
Digitizing Performance Graphs
Hi folks,
Has anyone had any luck digitizing performance graphs for take-off, landing, time to climb. Looking to fill out my W&B spread sheet to include all aspects of performance.
Much kudos in advance!
Has anyone had any luck digitizing performance graphs for take-off, landing, time to climb. Looking to fill out my W&B spread sheet to include all aspects of performance.
Much kudos in advance!


Joined: Jul 2007
Posts: 0
Likes: 0
From: Germany
Its also expensive - however, manufacturers can often have this data and will resell on as a service. i suspect though that you will be shipocked at the price- aviation isnt cheap!
Fleet Manager

Joined: Apr 2001
Aviation Qualifications: ATPL
Posts: 7,448
Likes: 310
From: various places .....
A conceptually straight forward exercise the technical difficulty of which is around mid-secondary school level maths.
Problem is that you MUST model the AFM lines, not the usual performance equations. The test of a good setup is that the delta between the accurately read line data and the computer output is both conservative and minimal. You cannot do a simple regression analysis as the errors will be too great. I did a lot of this stuff in the deep past - all good fun if excessively tedious.
Some thoughts -
(a) read off the points at a reasonable density consistent with the line shapes. Blow the AFM charts up. If you want to do it the hard way, rescale as photostats and then pore over the graphs with a magnifying glass reading off data points and setting up tables for the lines. Generally easier if you scan to high res and then do the reading in a vector package. Keep in mind the aim is to minimise the delta between the line and what you read while being conservative. Either way you end up with tabular data replacing the lines. If the AFM data was tabular to start with ... you can avoid this bit.
(b) set up a look up model. Either use the tabular data as a lookup table and interpolate or run regressions on sensible lengths of the lines. Don't even waste your time trying to determine regression coefficients for the usual squiggly lines .. won't work. Simple linear interpolation doesn't generally cut the mustard but there are standard techniques which help out
(c) test the model output against the read off tabular data. When you reckon you have an adequate balance between accuracy and conservatism move to the next activity
(d) set up the carpet models. That's just a computer analogy for reading the charts manually. Including enough relevant tests to capture errors and the like is where the time is spent.
(e) when you reckon you have it under control, run an every point comparison between the final model and the original read off data to check for errors.
Can you set this up in Excel ? Of course you can. Alternatively, use any of the appropriate programming languages.
Thread Starter
Joined: Jul 2015
Posts: 45
Likes: 0
From: NZ
Thanks John, just great mate! Not proficient in a programming language as yet, python is on the list though. For creating tabulised data I was looking at software like this http://plotdigitizer.sourceforge.net/.
Digitizing plots
Digitizing jpeg graphs http://rscriptsandtips.********.com/...have-been.html
Converting plots to data (i) http://wiekvoet.********.com/2014/01...s-to-data.html
Converting plots to data (ii) http://wiekvoet.********.com/2014/01...o-data-ii.html
Getting data from figures in published papers
Digitize graphs with multiple point sets
Digitizing data from old plots
How to digitize plots https://magesblog.com/post/2012-02-2...igitize-plots/
Wikipedia: Converting scanned graphs to data
Anyone had any success in this area that would care to share their results??
Last edited by AC103; 28th October 2018 at 20:16. Reason: **** inserted into some link urls for some reason
Joined: Jun 2002
Aviation Qualifications: PPL
Posts: 7,177
Likes: 297
From: Nanaimo (CAC8)
I've done a bit of digitizing for oil exploration projects. I've had great success using Plot Digitizer, free Java software that runs on a Mac, Windows or Linux. It's not perfect, but it gets the job done and is much quicker than picking numbers off plots by hand.
http://plotdigitizer.sourceforge.net
http://plotdigitizer.sourceforge.net
Fleet Manager
Joined: Apr 2001
Aviation Qualifications: ATPL
Posts: 7,448
Likes: 310
From: various places .....
Ooh, that's nice. My, things have progressed since I last played with this stuff .. back when it was do it yourself or buy very costly specialist software. l will have a looksee and be amazed.
Joined: Oct 2015
Posts: 28
Likes: 0
From: KPMD
I've successfully digitized graphs using Engauge Digitizer, an open source digitizer available for download on sourceforge. I will then curve fit using either Matlab or GNU Octave. I wouldn't use Excel curve fitting for anything but the simple linear and quadratic equations. You must be extremely careful to check the registration, as scanned of prints (like you would get from an old AFM downloaded from MyBoeiingfleet that has been scanned) usually have distortion.
Building a SCAP module is involved and requires access to an AFM or other primary source.
Building a SCAP module is involved and requires access to an AFM or other primary source.
Thread Starter
Joined: Jul 2015
Posts: 45
Likes: 0
From: NZ
I've successfully digitized graphs using Engauge Digitizer, an open source digitizer available for download on sourceforge. I will then curve fit using either Matlab or GNU Octave. I wouldn't use Excel curve fitting for anything but the simple linear and quadratic equations. You must be extremely careful to check the registration, as scanned of prints (like you would get from an old AFM downloaded from MyBoeiingfleet that has been scanned) usually have distortion.
Building a SCAP module is involved and requires access to an AFM or other primary source.
Building a SCAP module is involved and requires access to an AFM or other primary source.
FYI
Last edited by AC103; 28th October 2018 at 21:22.
Fleet Manager
Joined: Apr 2001
Aviation Qualifications: ATPL
Posts: 7,448
Likes: 310
From: various places .....
When you refer to "split axis", I presume you are looking at the usual parameterised carpet presentations. They can be treated just as sets of xy data.
Thread Starter
Joined: Jul 2015
Posts: 45
Likes: 0
From: NZ
Thanks for the language John! I am checking with www.OriginLab.com to see if their Digitizer supports carpet plots.
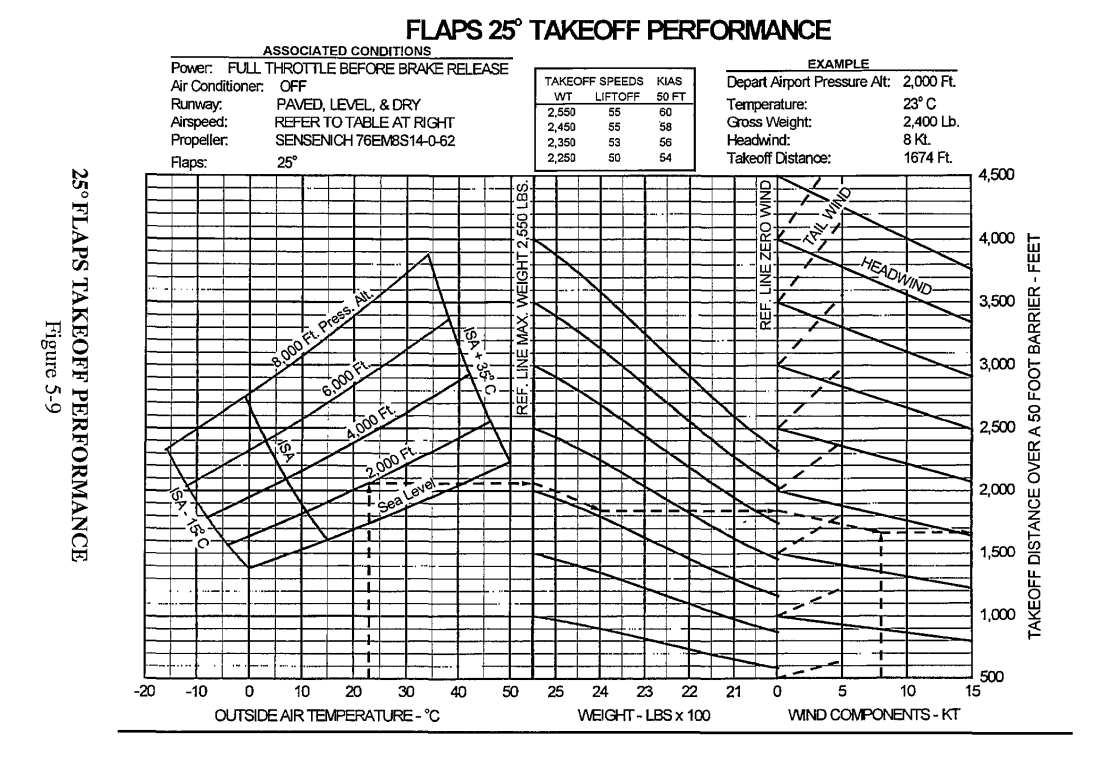
Anyone actually done this for a typical takeoff or landing performance chart?
Anyone actually done this for a typical takeoff or landing performance chart?
Fleet Manager
Joined: Apr 2001
Aviation Qualifications: ATPL
Posts: 7,448
Likes: 310
From: various places .....
Nothing fancy about carpet plots other than that they look fancy. Just a drafting sleight of hand to get multiple data sets onto the one bit of paper. Confused me for an hour or so when I first had to work out how it was done (50-odd years ago, now). Once it fell into place, it's a dead easy technique to apply. My approach when putting line segments into the PC is to run regressions on each of the segments and then play with the results.
Main thing is to break the segments up (as necessary) into smaller lengths so that they can be fitted with no more than a cubic. Higher orders can give you headaches with unwanted inflexions .. especially if you want to play with short extrapolations. One has to keep in mind the goal is that we are trying to replicate the AFM pictures, not the physics behind the lines.
My comment about Excel, elsewhere, was not to suggest you use it to run the regressions. However, it is a fine vehicle to structure the final data output engine. I don't even bother using Fortran any more in preference .. does anyone remember Fortran ?
Joined: Jul 2007
Posts: 0
Likes: 0
From: Germany
Yep. Used it extensively with Abaqus FEA to do complex structural analysis work. Think you can still use to this day, it's not all drag n drop unigraphics/catia if you need to do the complex stuff.
Certainly high strain stuff, complex pressure fields and complicated boundary conditions between adjacent parts (for example, a turbine for tree root).
Certainly high strain stuff, complex pressure fields and complicated boundary conditions between adjacent parts (for example, a turbine for tree root).
Last edited by VinRouge; 30th October 2018 at 15:35.
Fleet Manager
Joined: Apr 2001
Aviation Qualifications: ATPL
Posts: 7,448
Likes: 310
From: various places .....
Don't waste your time .. a multivariate regression won't work to a sensible accuracy in most all cases. Run regressions on each of the lines separately (and that might require the lines to be segmented), use that to look up some values for the independent variable of interest ... and then run a sensible interpolation or regression to get the final answer ... works real well.
The end requirement is negligible to no detectable delta betwixt the line data as she is read .. and the calculation as she is run .. and any delta must be conservative.
The end requirement is negligible to no detectable delta betwixt the line data as she is read .. and the calculation as she is run .. and any delta must be conservative.
Thread Starter
Joined: Jul 2015
Posts: 45
Likes: 0
From: NZ
Run regressions on each of the lines separately (and that might require the lines to be segmented), use that to look up some values for the independent variable of interest ... and then run a sensible interpolation or regression to get the final answer ... works real well.
