


Movement of the drag curve

Thread Starter

Joined: Mar 2006
Posts: 655
Likes: 4
From: On the water
Movement of the drag curve
Hi all
I have searched high and low for a good explanation for movement of the drag curve.
I'm primarily trying to understand questions such as:
Aircraft A and Aircraft B are the same type, travelling at the same altitude, at the same speed, in the same ISA conditions. Aircraft B is 20% heavier, what happens to the drag curve
Moves (and then combinations of UP, DOWN, LEFT, RIGHT)
Then going further, the same sort of questions but say Aircraft B extends LE devices, spoilers, gear or flap etc etc
I guess I'm a bit of a visual learner, so if anyone has links to graphs or can explain it in a straight forward manner, that'd help me out a lot.

Thread Starter
Joined: Mar 2006
Posts: 655
Likes: 4
From: On the water
Thanks for the tip, but would still appreciate an explanation, or link to a(legit) method of getting this information.
I would purchase this, but have an exam in a few days so won't have enough lead time...
I would purchase this, but have an exam in a few days so won't have enough lead time...
Joined: Jun 2010
Posts: 127
Likes: 0
From: Sydney
Instead of drawing only the total drag curve on paper, draw both the induced drag curve and the form drag curve on the same graph.
From there think of your change of configuration/speed/weight etc and then move each of the two drag curves seperatly (according to the change) as required.
This should give you an understanding of how each curve moves.
Then draw the new total drag curve on the graph and compare to the old total drag curve.
e.g: Gear down will move the form drag curve up. So draw a slightly higher form drag curve on your graph. Now superimpose the total drag curve...and compare to the old drag curve.
Hope that helps.
In short think of it as two curves that interact, not one curve.
Last edited by Professional Amateur; 29th March 2011 at 02:43. Reason: clarity

Joined: Dec 2010
Posts: 291
Likes: 2
From: Europe
Try this - I aplogise for the quality, it's copied off a spreadsheet.
Yellow lines are clean a/c, blue lines landing flap/gear up, red lines landing flap/gear down.
Double chain dots are lift dependent drag, single dashes profile drag and full lines are total drag.
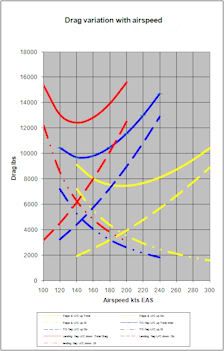
That should explain how the drag 'moves' with airspeed - the profile drag goes up as the square of EAS, the lift dependent drag goes down and the total change depends on what EAS you have to start with.
For change in weight at given EAS you just raise the lift dependent drag lines appropriately
Hope this helps
Yellow lines are clean a/c, blue lines landing flap/gear up, red lines landing flap/gear down.
Double chain dots are lift dependent drag, single dashes profile drag and full lines are total drag.
That should explain how the drag 'moves' with airspeed - the profile drag goes up as the square of EAS, the lift dependent drag goes down and the total change depends on what EAS you have to start with.
For change in weight at given EAS you just raise the lift dependent drag lines appropriately
Hope this helps
