


757/767 V-G Diagram?


Thread Starter
Join Date: May 2010
Location: FL600
Posts: 27
Likes: 0
Received 0 Likes
on
0 Posts
if you can get the the following data you can draw it
Vs1, Vmo, design limit load; you can draw it
Vs1, Vmo, design limit load; you can draw it
If anyone has one, I would be grateful if you could post it.

Thread Starter
Join Date: May 2010
Location: FL600
Posts: 27
Likes: 0
Received 0 Likes
on
0 Posts
Hi All,
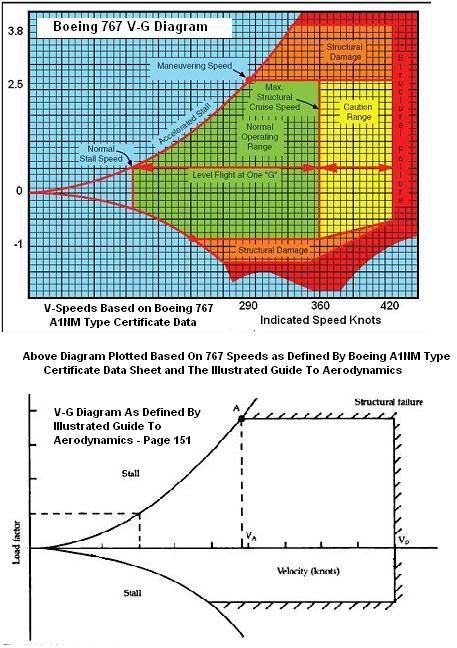
This was put together using a generic V-G, based on 767 speeds from the Boeing 767 Type Certificate Data Sheet A1NM and can be found here -
http://rgl.faa.gov/Regulatory_and_Guidance_Library%5CrgMakeModel.nsf/0/15302E51A401F11A8625718B00658962/$FILE/A1NM.pdf
767 speeds -
Va/Vra - 290
Vmo - 360
Vd - 420

Any objections to the above V-G diagram?
It's also based on (what everyone hopefully knows), this:

This was put together using a generic V-G, based on 767 speeds from the Boeing 767 Type Certificate Data Sheet A1NM and can be found here -
http://rgl.faa.gov/Regulatory_and_Guidance_Library%5CrgMakeModel.nsf/0/15302E51A401F11A8625718B00658962/$FILE/A1NM.pdf
767 speeds -
Va/Vra - 290
Vmo - 360
Vd - 420
Any objections to the above V-G diagram?
It's also based on (what everyone hopefully knows), this:
Join Date: Oct 2010
Location: California
Posts: 3
Likes: 0
Received 0 Likes
on
0 Posts
Taking a generic Vg diagram and adding numbers does not make it a 767 Vg diagram. A Vg diagram is produced from aero data for specific altitudes and weights. You took a generic Vg diagram, erased the legends and added your own legends erroneously.
Join Date: Sep 2008
Location: USA
Posts: 33
Likes: 0
Received 0 Likes
on
0 Posts
The weights and altitudes are based on the Boeing 767 A1NM Type Certificate Data Sheet.
The above V-G Diagram is good to almost 18,000 feet, where then the V-G diagram starts to shift to the left, lowering IAS for Vd.
From the TCDS -
VD = 420 KCAS to 17,854 ft/.91M above 23,000 ft, linear variation between these points.
A good explanation of this is found here.
http://www.biggles-software.com/software/757_tech/flight_instruments/_popup_for_40_vmo_mmo.htm
You can also learn more about the effects of weight and altitude and how it corresponds to a V-G shift here.
V-G Diagram Discussion - APS Emergency Maneuver Training | APS Emergency Maneuver Training
Join Date: Oct 2010
Location: California
Posts: 3
Likes: 0
Received 0 Likes
on
0 Posts
It was faked to fool people. It is not a 767 Vg diagram. What weight and altitude is the Vg diagram for? Right, it is a fake diargram made up to fool people, done by a conspracy theoriests on 911. He took a generic Vg diagram and place a new axis on, the scale is off.
A generic Vg diagram was plagiarized and photo-shopped to support some conspiracy theory a plane can't go faster than Vmo, or Vd.
The generic Vg diagram was from this web site - http://www.free-online-private-pilot-ground-school.com/Load_factors.html
The link you supplied confirms the Vg diagram is fake.
http://www.biggles-software.com/software/757_tech/flight_instruments/_popup_for_40_vmo_mmo.htm
The fake Vg diagram has "structural failure" to the right, not exactly the Boeing official words, "normal airplane handling characteristics are not assured". Don't be fooled by the conspiracy theorists trying to make up false claims.
A generic Vg diagram was plagiarized and photo-shopped to support some conspiracy theory a plane can't go faster than Vmo, or Vd.
The generic Vg diagram was from this web site - http://www.free-online-private-pilot-ground-school.com/Load_factors.html
The link you supplied confirms the Vg diagram is fake.
http://www.biggles-software.com/software/757_tech/flight_instruments/_popup_for_40_vmo_mmo.htm
Boeing airplanes are certified to this rule. Therefore, intentional exceeding of Vmo/Mmo is not permitted in normal operations. Exceeding Vmo/Mmo can pose a threat to exceeding design structural integrity and design stability & control criteria of the airplane. At speeds less than Vmo/Mmo the airplane�s flight characteristics have been confirmed by flight testing to meet FAR requirements. At speeds in excess of Vmo/Mmo, however, normal airplane handling characteristics are not assured.
Join Date: Sep 2008
Location: USA
Posts: 33
Likes: 0
Received 0 Likes
on
0 Posts
The diagram is not "fake". It is clearly plotted using the Speeds as set by Boeing input into a typical Flight Envelope. You can make your own if you know the speeds.
Here is another V-G to help you understand how a Flight envelope is constructed.
It was explained to you in the post above yours. Weights as outlined in the TCDS and good up to 18,000 feet. Above that the V-G moves to the left.
Here is another V-G to help you understand how a Flight envelope is constructed.
What weight and altitude is the Vg diagram for?
Join Date: Oct 2010
Location: California
Posts: 3
Likes: 0
Received 0 Likes
on
0 Posts
That is the same fake Vg diagram. Balsamo, the leader of pilots for truth, a silly conspiracy theorist group, faked the diagram (or you did). He took a generic Vg diagram and photoshopped in the legend. No matter how many times you show a fake Vg diagram, it will not be believed. The diagram has no weight. You confirm it is fake by saying it is for all weights and good up to 18,000 feet.
The other clue it is fake; not sourced from Boeing. Balsamo or you photoshopped it. The aircraft does not structurally fail at 420 knots 1 g flight at 18,000 feet. The legend does not line up properly.
Next time get the speed legend to line up with the grid on your fake diagrams. Please.
As explained in posts above, the diagram was faked using generic Vg diagrams. The fake 767 Vg diagram is not from Boeing Engineering. No legitimate source for the Vg diagram. RalphTheMouth was not a good source; was it sourced from him, or is A320 Balsamo?
Boeing 757 Boeing :: Vmo/Mmo Limitations Review
Join Date: Sep 2008
Location: USA
Posts: 33
Likes: 0
Received 0 Likes
on
0 Posts
As pointed out by PA above -
Since we have the TCDS for the aircraft, it is very simple to plot your own V-G diagram. Flight Instructors teach this to their students daily.
I see you have only 3 posts on this forum Keith (all of which are in this thread, and apparently you have an obsession with a guy named Balsamo), you may want to visit your local flight school to learn how to plot a V-G when the V-speeds are known and having a Type Certificate Data Sheet. It's not very hard to do. Matter of fact, the V-G post above from the Illustrated Guide To Aerodynamics and the Flight Envelope image from wiki are pretty straight forward.
File:PerformanceEnvelope.gif - Wikipedia, the free encyclopedia
This is pretty basic stuff. I'm surprised you don't already know this.
Vd ends the V-G diagram and is the beginning of the structural failure zone for every aircraft on planet earth, as described above by the Illustrated Guide To Aerodynamics. Again, if you need more help and don't want to listen to guys on some forum such as PA and me, visit a flight school.
if you can get the the following data you can draw it
Vs1, Vmo, design limit load; you can draw it
Vs1, Vmo, design limit load; you can draw it
I see you have only 3 posts on this forum Keith (all of which are in this thread, and apparently you have an obsession with a guy named Balsamo), you may want to visit your local flight school to learn how to plot a V-G when the V-speeds are known and having a Type Certificate Data Sheet. It's not very hard to do. Matter of fact, the V-G post above from the Illustrated Guide To Aerodynamics and the Flight Envelope image from wiki are pretty straight forward.
File:PerformanceEnvelope.gif - Wikipedia, the free encyclopedia
This is pretty basic stuff. I'm surprised you don't already know this.
Vd ends the V-G diagram and is the beginning of the structural failure zone for every aircraft on planet earth, as described above by the Illustrated Guide To Aerodynamics. Again, if you need more help and don't want to listen to guys on some forum such as PA and me, visit a flight school.
Last edited by A320Slave; 14th Feb 2012 at 19:02.
First, it should be easy enough, if there is a legitimate need, to source a Boeing V-G diagram. The fact that the "need" is based on a whacko 9-11 conspiracy theory probably takes going to Boeing out of the picture.
Second, while you can graph a few V speeds onto a generic V-G diagram and make it work for students, but hardly good enough for engineering data. There are lots more to a V-G diagram than those 3 speeds.
Last, an airplane does not suddenly come apart at the right side of the diagram, as any number of LOC events have shown in numerous types. There are a number of other factors to the right side-bird strike protection, flight control characteristics (aileron reversal, hydraulic control limits, wing bending) and flight test design. None of which was a concern to hijackers. I have no doubt a B757-767 could exceed the right side and maintain integrity for the short while they needed it.
GF

Join Date: Sep 2008
Location: USA
Posts: 33
Likes: 0
Received 0 Likes
on
0 Posts
All we are doing here is plotting a V-G diagram. I think you will agree that Vd is the end of the diagram and the start of the structural failure zone?
Agreed. But the diagrams offered above can hardly be considered "fake". It is constructed directly from the Boeing Type Certificate Data Sheet.
No one is claiming an aircraft breaks apart 1 knot over Vd. Keith is the only one making that claim in which he claims comes from some conspiracy site. But for some reason he does not want to source it.
Perhaps this is why.
Speeds Reported For World Trade Center Attack Aircraft Analyzed - Pilots For 9/11 Truth Forum
Such a claim was never made.
Exactly.
Second, while you can graph a few V speeds onto a generic V-G diagram and make it work for students, but hardly good enough for engineering data. There are lots more to a V-G diagram than those 3 speeds.
No one is claiming an aircraft breaks apart 1 knot over Vd. Keith is the only one making that claim in which he claims comes from some conspiracy site. But for some reason he does not want to source it.
Perhaps this is why.
Speeds Reported For World Trade Center Attack Aircraft Analyzed - Pilots For 9/11 Truth Forum
Such a claim was never made.
There are a number of other factors to the right side-bird strike protection, flight control characteristics (aileron reversal, hydraulic control limits, wing bending) and flight test design.
Last edited by A320Slave; 14th Feb 2012 at 19:36.
