


Do as I say, not as I did this morning...

Thread Starter
Join Date: Apr 2003
Location: UK
Posts: 233
Likes: 0
Received 0 Likes
on
0 Posts
Do as I say, not as I did this morning...
Firstly let's start with the obvious disclaimers...
- I will report this through the proper channels in the next few days.
- I am reconsidering my choice of aviation chart.
Anyhow, today. I needed to go and see somebody on the Isle of Wight, and had just taken off from Wycombe Air Park, having planned a route that was pretty much direct - initially more or less overhead WOD NDB, then overhead RAF Odiham. Nice day, nil cloud, 40km+viz, great excuse to go flying.
I was using a Jeppesen VfrGps 1:500,000 chart, specifically No.EG2 issued February 2005, which is still the current one. A short extract from it, showing my route is below (ignore the scribbled numbers, those will become clear in a minute)...
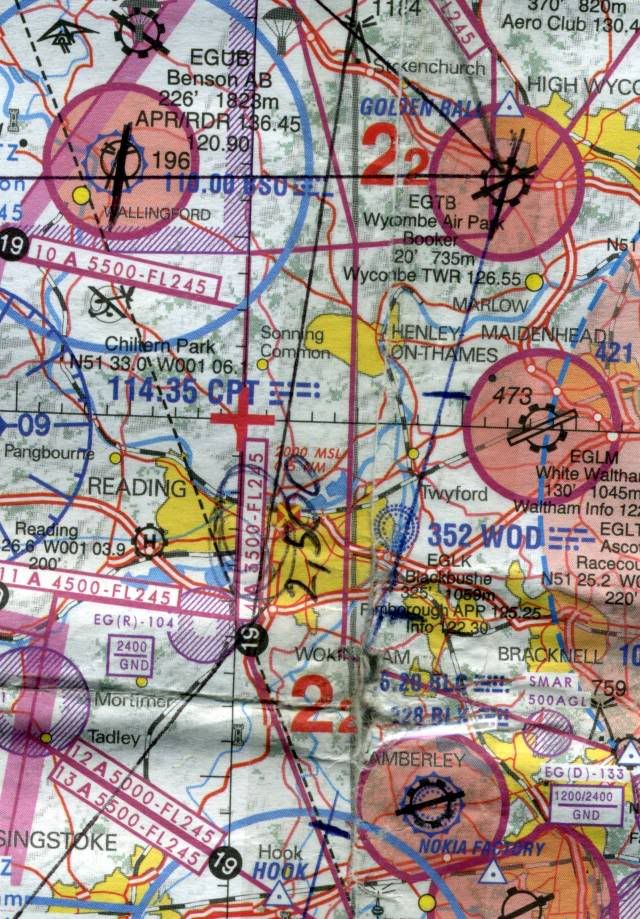
Ignore my scribbled numbers for the moment, the chart shows class A Airspace starting at 3,500ft. Wanting height (to clear above Odiham shortly) I had climbed to 3,400ft.
Roundabout WOD, I called Farnborough RADAR for a FIS (was already squawking 7000C). Was immediately told I was in controlled airspace and to descend below 2,400ft. Unsurprisingly I did.
Closer inspection of my chart showed no such thing, but assuming I'd screwed up (it happens) simply apologised and promised not to do it again.
Got to Sandown, borrowed somebody else's CAA chart for a look. That clearly shows 2,500ft, not the 3,500ft on my Jeppesen chart (would have bought one as well, but there wasn't a functioning pilot shop that I could find).
Got home at the end of a (thankfully otherwise uneventful) day and decided to check Jeppesen's website....
Damned if I can see any reference to correcting the height of that class A.
Anyhow, I screwed up - however inadvertently. I'll flag this up to the powers that be but please - nobody else do the same thing!
P
- I will report this through the proper channels in the next few days.
- I am reconsidering my choice of aviation chart.
Anyhow, today. I needed to go and see somebody on the Isle of Wight, and had just taken off from Wycombe Air Park, having planned a route that was pretty much direct - initially more or less overhead WOD NDB, then overhead RAF Odiham. Nice day, nil cloud, 40km+viz, great excuse to go flying.
I was using a Jeppesen VfrGps 1:500,000 chart, specifically No.EG2 issued February 2005, which is still the current one. A short extract from it, showing my route is below (ignore the scribbled numbers, those will become clear in a minute)...
Ignore my scribbled numbers for the moment, the chart shows class A Airspace starting at 3,500ft. Wanting height (to clear above Odiham shortly) I had climbed to 3,400ft.
Roundabout WOD, I called Farnborough RADAR for a FIS (was already squawking 7000C). Was immediately told I was in controlled airspace and to descend below 2,400ft. Unsurprisingly I did.
Closer inspection of my chart showed no such thing, but assuming I'd screwed up (it happens) simply apologised and promised not to do it again.
Got to Sandown, borrowed somebody else's CAA chart for a look. That clearly shows 2,500ft, not the 3,500ft on my Jeppesen chart (would have bought one as well, but there wasn't a functioning pilot shop that I could find).
Got home at the end of a (thankfully otherwise uneventful) day and decided to check Jeppesen's website....
Damned if I can see any reference to correcting the height of that class A.
Anyhow, I screwed up - however inadvertently. I'll flag this up to the powers that be but please - nobody else do the same thing!
P

Looking at the same chart, there's a A2,500-FL245 marker at about Hemel Hempsted, but if it's applicable it's far from clear (not sure I can convince myself of it), since it's halfway around the other side of London.
G
G
Spoon PPRuNerist & Mad Inistrator
Pilotage,
Without seeing the whole of the Jep chart for the LTMA it's not possible to know if your (mis)interpretation was (in)correct (delete as appropriate .
.
On the portion of the chart in your post, though, you can clearly see the "steps" - from East to West, there's the dashed blue line marking the edge of the Sfc-2500 CTR, then the purple line running N-S just W of Henley - WOD marking the edge of the 2500+ LTMA step, then the purple line on the 1 deg W line - which is marked on your Jep chart as 3500-FL245.
On my CAA chart, the 2500+ LTMA line isn't marked as such at that location - however, it is marked clearly to the S and N of that area - right beside Wycombe Air Park, as a matter of fact
Is it possible that the "middle" line is noted elsewhere on the Jep chart and that you have missed it?
Without seeing the whole of the Jep chart for the LTMA it's not possible to know if your (mis)interpretation was (in)correct (delete as appropriate
.On the portion of the chart in your post, though, you can clearly see the "steps" - from East to West, there's the dashed blue line marking the edge of the Sfc-2500 CTR, then the purple line running N-S just W of Henley - WOD marking the edge of the 2500+ LTMA step, then the purple line on the 1 deg W line - which is marked on your Jep chart as 3500-FL245.
On my CAA chart, the 2500+ LTMA line isn't marked as such at that location - however, it is marked clearly to the S and N of that area - right beside Wycombe Air Park, as a matter of fact
Is it possible that the "middle" line is noted elsewhere on the Jep chart and that you have missed it?
Thread Starter
Join Date: Apr 2003
Location: UK
Posts: 233
Likes: 0
Received 0 Likes
on
0 Posts
Looking at it in light of your and Genghis' comments, that N-S line a couple of Nm east of the one markedA3500-FL245 certainly appears to separate some other airspace - possibly that indicated by the marker at Hemel/Albans. Certainly very unclear however if this is true.
The CAA chart I looked at was certainly extremely clear as you say, and there was no doubt that this airspace started at 2,500 where I'd climbed up into it.
P
The CAA chart I looked at was certainly extremely clear as you say, and there was no doubt that this airspace started at 2,500 where I'd climbed up into it.
P
Last edited by Pilotage; 5th Apr 2006 at 22:41.
Join Date: May 2001
Location: up North
Posts: 661
Likes: 0
Received 0 Likes
on
0 Posts
Whilst I agree that the CAA chart is clearer, the height data for that portion of airspace down to 2500ft is still tucked away to the northeast.

On the CAA chart the LTMA section starting at 3500ft is much clearer, which is a big hint that the airspace to the east is lower - even though you have to look over to Hemel to find the info..
Airspace boundaries on the CAA charts are much more distinct.. (and yes, it is an old chart)..
On the CAA chart the LTMA section starting at 3500ft is much clearer, which is a big hint that the airspace to the east is lower - even though you have to look over to Hemel to find the info..
Airspace boundaries on the CAA charts are much more distinct.. (and yes, it is an old chart)..
The Jepp chart seems to correctly label the A3500 floor of the LTMA which runs in a narrow N-S band in the Henley-Reading vicinity.
I do not see a Jepp label for the A2500 floor on the boundary immediately East, but an A2500 label should be somewhere in the bounded area. Just how far away is a good question.
I would pencil in A2500 over by Twyford.
I do not see a Jepp label for the A2500 floor on the boundary immediately East, but an A2500 label should be somewhere in the bounded area. Just how far away is a good question.
I would pencil in A2500 over by Twyford.
PPruNaholic!
Join Date: Aug 2000
Location: Buckinghamshire
Age: 61
Posts: 1,615
Likes: 0
Received 0 Likes
on
0 Posts
Pilotage, mate... are you normally based in Wycombe or were you just passing through? If you are a locally based pilot them I am stunned that you are not generally aware of the nature of the LTMA airspace overhead and nearby the field.
Andy
Andy
Thread Starter
Join Date: Apr 2003
Location: UK
Posts: 233
Likes: 0
Received 0 Likes
on
0 Posts
RBF - Yep.
Aussie - Becoming local, and rapidly becoming more familiar. But like most people, learning the area from my usual chart. Something that's done me no favour on this occasion.
Jabberwork - As it happens, the CAA chart I borrowed was a 1:250,000 which was much clearer than the 1:500,000 you've showed, but that is certainly clear enough nonethless.
P
Join Date: Feb 2002
Location: Dublin
Posts: 2,547
Likes: 0
Received 0 Likes
on
0 Posts
Aw now Andy!!
Surely the point of a chart is that you don't have to be a local!
If we all stuck to our local area, sure there would be no need for charts, but that's not really practical. You should be able to read the chart quickly and accurately, and not need local knowledge.
I bought a set of Jepp charts once, and will never again. I remember looking at some of the airspace in the Irish Sea, and despite how much time I spend looking at it (on my dining room table, not in a busy cockpit), I couldn't figure out what certain bits of airspace was. Where airspace met, it was simply not possible to tell which bit turned which way.
Pilotage, you have my sympathies.
dp
PPruNaholic!
Join Date: Aug 2000
Location: Buckinghamshire
Age: 61
Posts: 1,615
Likes: 0
Received 0 Likes
on
0 Posts
Surely the point of a chart is that you don't have to be a local!
Join Date: Sep 2003
Location: Retford, UK
Posts: 476
Likes: 0
Received 0 Likes
on
0 Posts
I've never seen a Jeppesen VFR chart before until now, but it certainly doesn't look anything like as clear as the CAA one. Having said that, I think anyone who can provide a clear representation of the complicated airspace around London along with all the airfields and other features at 1:500,000 scale has done a very difficult job.
The other thing that occurred to me is that the Jepp chart will rely on re-intepretation of the CAA's airspace data, which is adding another opportunity for mistakes to be made "in translation".
The other thing that occurred to me is that the Jepp chart will rely on re-intepretation of the CAA's airspace data, which is adding another opportunity for mistakes to be made "in translation".
Join Date: Sep 2002
Location: Savannah GA & Portsmouth UK
Posts: 1,784
Likes: 0
Received 0 Likes
on
0 Posts
The CAA have a feedback form for charts at http://www.caa.co.uk/default.aspx?ca...90&pageid=2149, you'll also find links to chart amendments on that page.
The CAA's VFR Chart Editor is off to Florida next month to do her PPL and the previous incumbent was a pilot who went on to a career in commercial aviation. Maybe it helps to have a UK GA pilot editing the UK chart.
Mike
The CAA's VFR Chart Editor is off to Florida next month to do her PPL and the previous incumbent was a pilot who went on to a career in commercial aviation. Maybe it helps to have a UK GA pilot editing the UK chart.
Mike
Join Date: May 2001
Location: up North
Posts: 661
Likes: 0
Received 0 Likes
on
0 Posts
I feel a certain sympathy for chart creators, especially those making the half mil series for the UK. There is a huge amount of information to cram into these and to make it all easily readable is no mean task. As MichaelJP59 says, the area around London must be a nightmare to draw.
It took me a while to adjust to the section of chart shown by Pilotage but I can see it has certain strengths over the CAA chart. The airfield ATZ and runway data are nicely done and railway lines clearer. On the downside layout is slightly less clear and the written data for Blackbushe is smaller type and rather distant from the airport.
The CAA charts are not without criticism either. They reproduce the lower airways system completely and the many changes of airway bases results in a lot of lines drawn on the chart that mask more important data. If a chart was produced that limited airspace data to say FL100 it would clear up some areas quite a lot. I had a set of the trial Low Level half mil charts and I thought them very good indeed.
Grumbles aside though I take my hat off to the people who do this work - I know I couldn't!
My pet hate about charts is that built up areas are shown in lurid yellow. This makes them some of the most distinctive objects on the chart although I consider urban areas low down on my list of navigational objects.
Does anyone else have a pet dislike of chart features?

Join Date: Aug 2002
Location: Surrey, UK.
Posts: 0
Likes: 0
Received 0 Likes
on
0 Posts
Originally Posted by Pilotage
...Got to Sandown, borrowed somebody else's CAA chart for a look. That clearly shows 2,500ft, not the 3,500ft on my Jeppesen chart.
...Damned if I can see any reference to correcting the height of that class A.
P
...Damned if I can see any reference to correcting the height of that class A.
P
The next purple line east (towards the LHR CTR) is where the base drops to A2500', and the WOD beacon is between that and the CTR hence within the A2500' base LTMA.
Notwithstanding the lack of numbers nearby to show the reduced base, what did you think this inner line meant?
It must surely have been obvious it was going to be lower than the A3500' of the more western line (else why draw another line), and it wasn't going to be as low (Gnd. Level) as the CTR lines -- therefore it must be between Gnd. and A3500'.
Base at A2500' or A1500' could have been good guesses as to what that line delineates.
Join Date: Feb 2003
Location: The Front of Beyond
Posts: 376
Likes: 0
Received 0 Likes
on
0 Posts
Pilotage,
My commiserations. I have to agree that the Jep chart isn't very clear about the base of the CAS in the area.
Having done all my flying at Wycombe, and only every used the CAA charts I've always been aware of the varying heights of CAS in the ATZ (anything between 2500' and 4500'), and I'm pretty sure the boundaries have changed over the years I've been there (perhaps I'll dig out an old chart and check that). It does mean that you need to keep your wits about you, eg if departing off runway 24 towards the CPT VOR initially the base of CAS is 3500', but your track will clip the corner of the 2500' section of CAS near Henley.
There but for the grace of god go most of us.
Brooklands
PPruNaholic!
Join Date: Aug 2000
Location: Buckinghamshire
Age: 61
Posts: 1,615
Likes: 0
Received 0 Likes
on
0 Posts
There but for the grace of god go most of us.
As it happens, I have just bought a Jepp Nth UK / half or Northern Ireland chart to facilitate my forthcoming trip to visit DublinPilot via IoM and NI - becaiuse the new CAA version isn't out until May and I didnn't feel like forking out �15 for an out-of-date one... the Jepp non-laminated was current and about �9. So I guess I will be checking and re-checking various bases of CTA carefully!
Andy
Join Date: Aug 1999
Location: Too Far North
Posts: 1,106
Likes: 0
Received 0 Likes
on
0 Posts
What is the grey line on the Jep chart that runs north/south and is aligned with the 2500ft boundary?
It does not feature on the CAA chart and it does help in hiding the line on the Jep chart.
It does not feature on the CAA chart and it does help in hiding the line on the Jep chart.
