What is hilarious,
Duff Man, is your waltzing into this discussion and naively believing it is all about one reading. Do you realise just how ignorant you look?
Rutherglen, Victoria. Remember that name. This is the place where the questionable methodologies of the BOM are at their most apparent.
The BOM do something called "homogenisation" to all the recorded temperature readings. The temperature record then holds "homogenised" readings that are nothing like what was recorded on the ground at the time.
Yes, that's right - the temperature record is no longer a series of raw data readings, but a set of "homogenised" values.
Look at this:
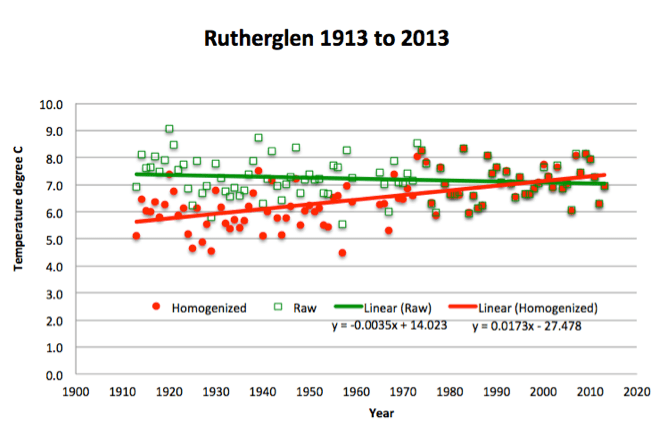
What you see is 100 years of Rutherglen's temperature data. The raw readings (green) and the "homogenised" (red). The BOM do not dispute this data or any of the readings. Does anything look fishy to you?
That graph was taken from this page. Take a look:
Rutherglen - Jennifer Marohasy
While you're there, look at this. More background on other places around Australia where a clear cooling trend, thanks to "homogenisation", has been turned into a warming trend:
https://ipa.org.au/wp-content/upload...Rutherglen.pdf