Pb Ballon is correct
The voluntary contributions of the APS folks on blogs often remind me of the old saying: "No kind act goes unpunished."

oggers, let me answer each one at a time.
1.The particular aircraft RV6/O320 I referred to is a conforming engine sans carbie heat. Don't know why and don't care either. On the odd occasion I crack the throttle off the WOT position, another technique that helps in some aircraft because it makes some turbulent flow. Non of what I said is contradicting what Walter said, some times you get lucky and some times you have to deploy all the tricks in the book. There is a PA24 in my hangar that has a multitude of issues of which I am working through, but so far the F/A ratio's are so poor even running full rich it is a nightmare. Yet the LAME's and engine builder have their head in the sand on it. I will win eventually even if all we do is get the ROP side of things wring right. There is no one size fits all with carby engines I am afraid.
2. I think you will find Walter was referring to the EMS visual verification by reference to the EGT values, it is fair to assume the slow leaning process used here will not yield any perceivable deceleration at all. If however a BMP is the way you do it, you will feel the deceleration and not see the EMS trends because it is done quickly. (You really do need to spend a weekend in class, Ada OK in a couple of weeks is your next chance).
3. Answres in red here;
I don't think that leaning until you get a 100rpm drop is too difficult for the average pilot. No it is not, but with a C/S prop it is so it is not a one size fits all deal hereDoing that from 100% power is the concern especially as Walter is now doing that with carb heat applied.Here again you show the need to do the course and understand the science. I will explain below but read Lead Ballons opening line about how easy it is to teach on a forum. I would like to see your data for doing this with a carb engine. Simply describing the priocess raises more questions than it answers. This is why we take hours of questions at breaks, lunch breaks, over dinner during a class weekend. If you do not understand from the class we try to explain it better for you during the break.
Detail on starting at 100% power and going LOP.

Simply put when you do a BMP at any power setting you end up on the graph at the point around the most efficient or where best 1/BSFC peaks. So at 100%, scooting down the beach having a ball��the BMP achieves what the old radial airliners did with a 10% BMEP drop, if that is done in my aircraft with a CSU its stays at 2700, if its a FP it drops around 100 RPM, and you get around 88% power typically because unless the QNH is really high you never had 100% anyway even with the wheels in the water

At high powers you want to be around 80dF LOP (70-90 range these are rubbery figures and we do not split atoms here), and that will coincide with about the 10% or so power drop.
There is no problem doing this at all. None, Zip,Zilch�.and the engine will run for thousands of hours like this happily. This is how your diesels and turbines run so why not your IO540. The CHTs will be 30-40dF lower and this confirms the ICP is lower than when full rich, what is not to like.
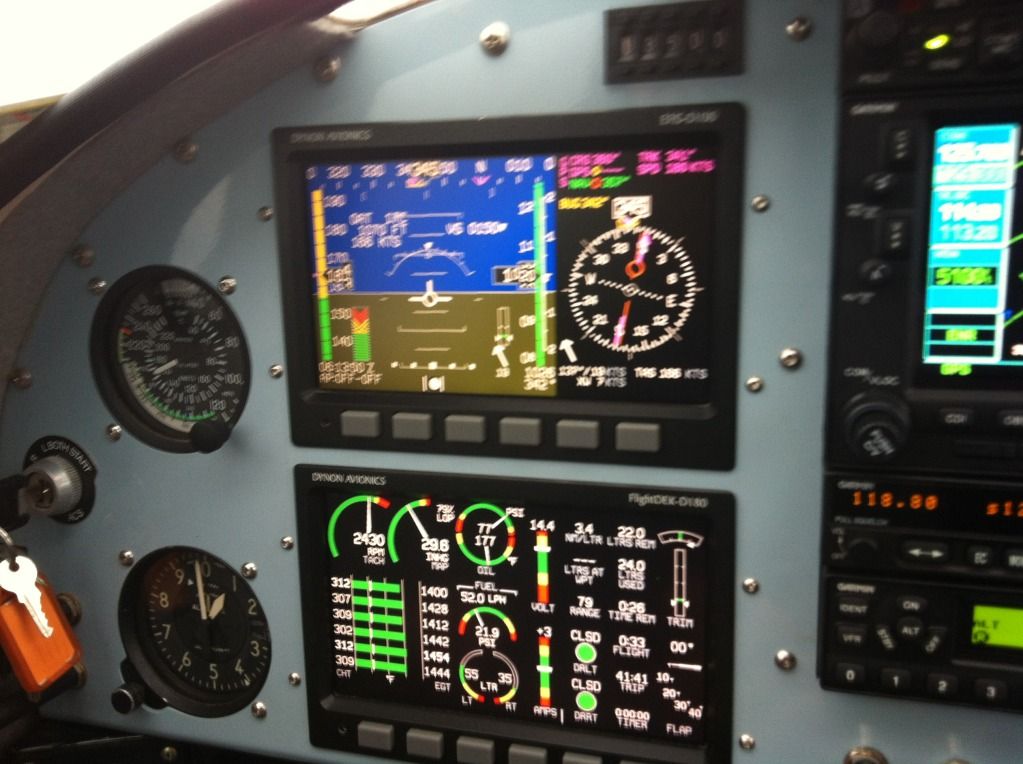
I don't have a 10' 2700 RPM photo, because that would be illegal here (wish I did) but I have done LOP take-offs at around 91% power, and the take off run for my plane becomes like a Bonanza, almost exactly and the CHT's are unbelievable good. Most GA planes need the extra ponies so it is not suggested for everyone else. But it proves the point well. What I do have is an old photo from when "morno" was flying and this is 1000' and 2400 RPM, and the power was about 80%. Enjoy!
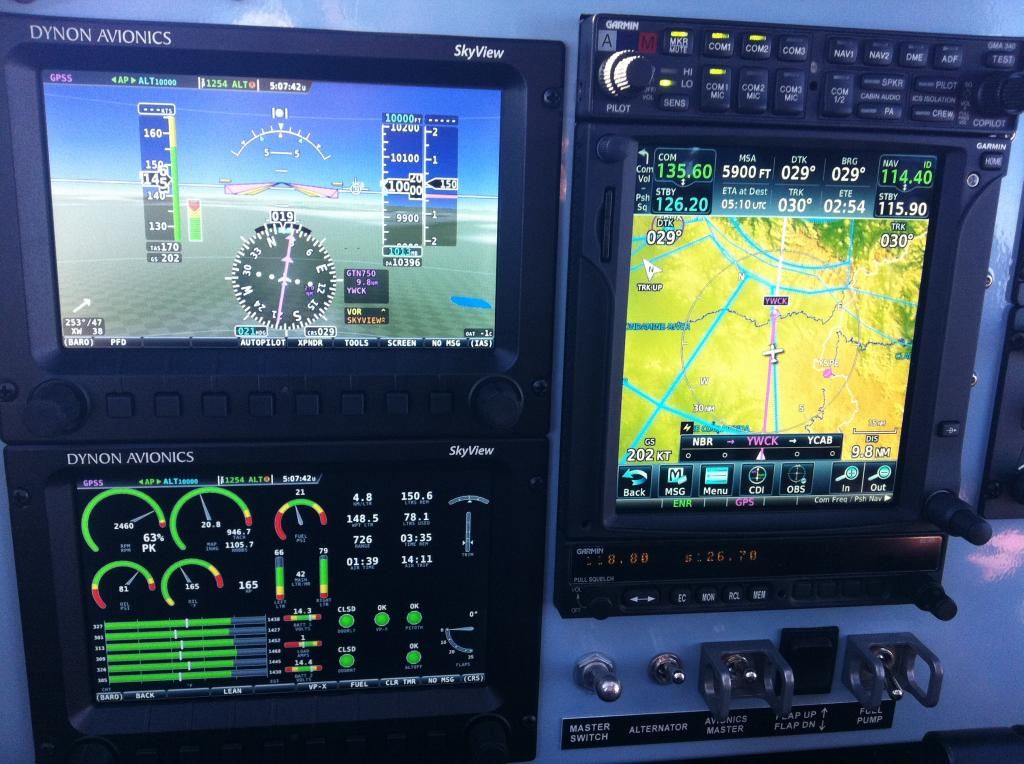
Here is one in the cruise at 10,000' (new panel)
And here is the concept graph, derived from real data, and all the answers to your questions can be found here. The two brown 1/BSFC curves represent a moderately high power, say 80-85% for the unbroken line and about 70-75% for the broken brown line. As the %age power reduces that brown line peaks a little further to the right. If it were 65% power or less it would peak in the -10 to -20 from peak region.
If you want to see all the data�and there is tonnes of it, you need to either be in Ada OK in a few weeks, BNE Qld next year, or do the online class (good but no Q&A sessions with that!). Beyond that I think we have exhausted the forum concept.
If anyone else has questions please fire away.