Is this/was the Game plan Qantas management are/were following?
Growth–share matrix
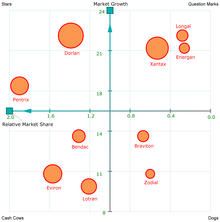
Portfolio growth–share matrix
Overview
To use the chart, analysts plot a scatter graph to rank the business units (or products) on the basis of their relative market shares and growth rates.
- Cash cows is where a company has high market share in a slow-growing industry. These units typically generate cash in excess of the amount of cash needed to maintain the business. They are regarded as staid and boring, in a "mature" market, yet corporations value owning them due to their cash generating qualities. They are to be "milked" continuously with as little investment as possible, since such investment would be wasted in an industry with low growth.
- Dogs, more charitably called pets, are units with low market share in a mature, slow-growing industry. These units typically "break even", generating barely enough cash to maintain the business's market share. Though owning a break-even unit provides the social benefit of providing jobs and possible synergies that assist other business units, from an accounting point of view such a unit is worthless, not generating cash for the company. They depress a profitable company's return on assets ratio, used by many investors to judge how well a company is being managed. Dogs, it is thought, should be sold off.
- Question marks (also known as problem children) are business operating in a high market growth, but having a low market share. They are a starting point for most businesses. Question marks have a potential to gain market share and become stars, and eventually cash cows when market growth slows. If question marks do not succeed in becoming a market leader, then after perhaps years of cash consumption, they will degenerate into dogs when market growth declines. Question marks must be analyzed carefully in order to determine whether they are worth the investment required to grow market share.
- Stars are units with a high market share in a fast-growing industry. They are graduated question marks with a market or niche leading trajectory, for example: amongst market share front-runners in a high-growth sector, and/or having a monopolistic or increasingly dominant USP with burgeoning/fortuitous proposition drive(s) from: novelty (e.g. Last.FM upon CBS Interactive's due diligence), fashion/promotion (e.g. newly prestigious celebrity branded fragrances), customer loyalty (e.g. greenfield or military/gang enforcement backed, and/or innovative, grey-market/illicit retail of addictive drugs, for instance the British East India Company's, late-1700s opium-based Qianlong Emperor embargo-busting, Canton System), goodwill (e.g. monopsonies) and/or gearing (e.g. oligopolies, for instance Portland cement producers near boomtowns), etc. The hope is that stars become next cash cows.
Stars require high funding to fight
competitions and maintain a
growth rate. When industry growth slows, if they remain a niche leader or are amongst market leaders its have been able to maintain their category leadership stars become cash cows, else they become dogs due to low relative
market share.As a particular industry matures and its growth slows, all business units become either
cash cows or
dogs. The natural cycle for most business units is that they
start as
question marks, then turn into
stars. Eventually the market stops growing thus the business unit becomes a
cash cow. At the end of the cycle the cash cow turns into a
dog.
As BCG stated in 1970:
Only a diversified company with a balanced portfolio can use its strengths to truly capitalize on its growth opportunities. The balanced portfolio has:
- stars whose high share and high growth assure the future;
- cash cows that supply funds for that future growth; and
- question marks to be converted into stars with the added funds.

BCG-matrix.png
"
To be successful, a company should have a portfolio of products with different growth rates and different market shares. The portfolio composition is a function of the balance between cash flows. High growth products require cash inputs to grow. Low growth products should generate excess cash. Both kinds are needed simultaneously."—Bruce Henderson
For each product or service, the 'area' of the circle represents the value of its sales. The growth–share matrix thus offers a "map" of the organization's product (or service) strengths and weaknesses, at least in terms of current profitability, as well as the likely cashflows.
The need which prompted this idea was, indeed, that of managing cash-flow. It was reasoned that one of the main indicators of cash generation was relative market share, and one which pointed to cash usage was that of market growth rate.
Relative market share
This indicates likely cash generation, because the higher the share the more cash will be generated. As a result of 'economies of scale' (a basic assumption of the BCG Matrix), it is assumed that these earnings will grow faster the higher the share. The exact measure is the brand's share relative to its largest competitor. Thus, if the brand had a share of 20 percent, and the largest competitor had the same, the ratio would be 1:1. If the largest competitor had a share of 60 percent; however, the ratio would be 1:3, implying that the organization's brand was in a relatively weak position. If the largest competitor only had a share of 5 percent, the ratio would be 4:1, implying that the brand owned was in a relatively strong position, which might be reflected in profits and cash flows. If this technique is used in practice, this scale is logarithmic, not linear.
On the other hand, exactly what is a high relative share is a matter of some debate. The best evidence is that the most stable position (at least in
fast-moving consumer goods markets) is for the brand leader to have a share double that of the second brand, and triple that of the third. Brand leaders in this position tend to be very stable—and profitable; the Rule of 123
The reason for choosing relative market share, rather than just profits, is that it carries more information than just cash flow. It shows where the brand is positioned against its main competitors, and indicates where it might be likely to go in the future. It can also show what type of marketing activities might be expected to be effective.
Market growth rate
Rapidly growing in rapidly growing markets, are what organizations strive for; but, as we have seen, the penalty is that they are usually net cash users – they require investment. The reason for this is often because the growth is being 'bought' by the high investment, in the reasonable expectation that a high market share will eventually turn into a sound investment in future profits. The theory behind the matrix assumes, therefore, that a higher growth rate is indicative of accompanying demands on investment. The cut-off point is usually chosen as 10 per cent per annum. Determining this cut-off point, the rate above which the growth is deemed to be significant (and likely to lead to extra demands on cash) is a critical requirement of the technique; and one that, again, makes the use of the growth–share matrix problematical in some product areas. What is more, the evidence, from
fast-moving consumer goods markets at least, is that the most typical pattern is of very low growth, less than 1 per cent per annum. This is outside the range normally considered in BCG Matrix work, which may make application of this form of analysis unworkable in many markets. Where it can be applied, however, the market growth rate says more about the brand position than just its cash flow. It is a good indicator of that market's strength, of its future potential (of its 'maturity' in terms of the market life-cycle), and also of its attractiveness to future competitors. It can also be used in growth analysis.