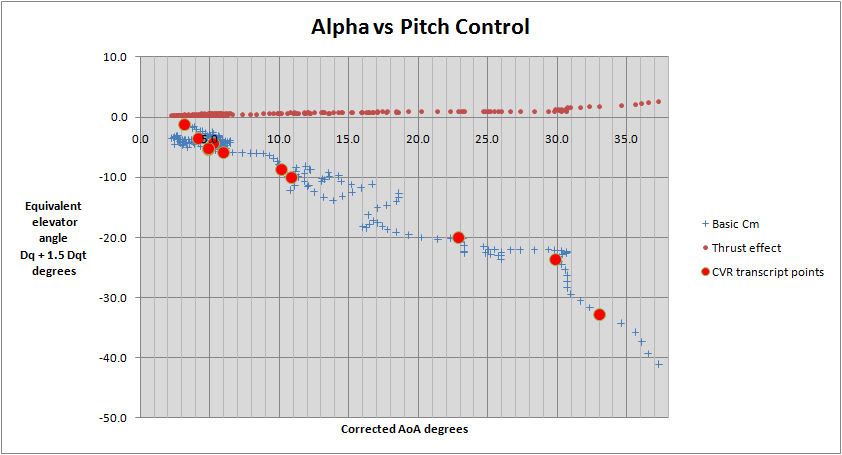
"> I thought hard about the wisdom of posting this, but in the end decided to take the plunge. This chart takes the AOA values listed as valid in the notes accompanying the CVR transcript together with some additional data read off a digitised version of the traces and combines them with elevator and THS deflections. It has been said several times on this thread that the THS is more powerful than the elevators, usually with a �much� adjective. In fact, for the A330 geometry and using standard aerodynamic calculation methods it turns out that 1 deg of THS is roughly equivalent to 1.5 deg elevator. So if we multiply the THS deflection by 1.5 and add that to the elevator deflection (with appropriate signs of course) we get an �equivalent elevator deflection�. This is what I used to get the graph.">
">
I have plotted it with the AOA as the X axis because in that way it doubles as a qualitative pitching moment curve � if the aircraft is in equilibrium then the tail pitch will be equal and opposite to the wing/body contribution. Obviously, this hides any pitch damping or thrust contributions to pitching moment. We can�t do much about the damping, because the scale of the traces doesn�t allow one to get anything like credible values of pitch rate and we know nothing at all about pitch damper gains. One can try to assess the thrust effects, although without access to actual engine thrust variations with rpm, altitude and airspeed it is going to be rather rough and ready. Don�t shoot the messenger � he is only trying to get a ROM. The second line on the chart shows such a ROM. Beyond the AOA limit shown the thrust effect increases sharply, due to a combination of increased thrust as a result of altitude changes and the drastically reduced airspeed which makes thrust effects much more powerful. Unfortunately, this is an area where the speed indication becomes unreliable.
Apart from the fact that this graph gives some indication of the AOA you can expect for a given set of tail deflections, the important thing for me is that there is no indication of any stall. OK, there is the faintest trace of a pitch break at 30 deg AOA, but in no way can that be considered as � a nose down pitch that cannot readily be arrested� since it was clearly possible to go to even higher AOAs by the application of more NU commands. There is another possible pitch break at around 19 deg AOA, but just before this point there was a lot of sidestick activity and pitch response, so the damping terms may be important. also the same comment that it was not a nose down pitch that could not be arrested.
So when we talk of the PF not recognising that he was stalled, one of the classic indications was missing.
The other criterion specified in the rule book [and incidentally the A330 was not certificated to CS25, but to JAR25 Change 13 � similar but not exactly so] is buffet. If you look at the plot in 1.16.5.2 of the BEA report the main change at the stall seems to be the appearance of a 5 Hz component. The report does mention that the �g� at the cockpit would be significantly greater than that at the CG, but this must also be true to some extent for the turbulence generated accelerations. Both relationships will depend on the fuselage structural modes, but from what I remember of mode shapes it would be primarily the first bending mode that generates high motions up front and that would not be a 5 Hz mode.
I will bow to any pilot opinion that differs, but it seems to me to be perhaps expecting too much for a pilot to distinguish a change in frequency content of cockpit motion when he has been experiencing turbulence and was expecting more severe turbulence to come shortly. I note that the AI Chief Test Pilot has said that it is very difficult, even for experienced test pilots, to distinguish the transition into stall.
If there is no pitch break and the buffet is difficult to interpret, he would have been thrown back on symptoms that do not appear in the JAR description of stalls � high attitude and inability to arrest the rate of descent � but over to pilots to evaluate those.
One other thing that is hardly rocket science either but will probably surprise many people is the THS behaviour. THS AOA is just the body AOA less downwash and THS setting. The downwash is usually expressed as a value at zero AOA plus a downwash gradient relating downwash and AOA. I have used 1deg and 0.4 if anyone cares.
The aircraft first went into the final stall at about 02:11:55 at which time the AOA was around 10 deg and the THS at -3.4. Downwash was 5 deg, so the THS angle of attack was 1.6 degrees
positive. The THS arrived at -13.6 at 02:12:27, when the AOA was over 40 deg. With the above assumptions the downwash would have been 17 deg and the THS angle of attack 9.5 deg
positive. There are arguments to suggest that this is an overestimate of downwash behind a stalled wing, so the THS AOA would have been at least this positive value.
For virtually the whole of the event, and certainly for the whole time the aircraft was stalled, the THS had a positive AOA so that
it was generating upwards lift and a nose down pitching moment despite the fact that it was set at -13.5 degrees!. This is consistent with it being a stable aeroplane as shown by that pitching moment curve.
Of course the net HS lift was negative and the net pitching moment positive (nose up), but this was made up of a very large downwards lift from the elevators partly offloaded by the positive lift from the THS itself. If the elevator had been returned to neutral the THS lift would have given a ND pitch and attitude reduction. Look at the traces - that is exactly what happened!
The nose was being held up by the application of elevator.
Of course, the THS setting made the elevator�s job easier, and if the THS had been (sensibly in my view) restricted to 3 deg the eventual AOA would have been lower, How much lower you can get from the first chart � with 3 deg THS and 30 deg elevator you could expect to arrive at 35 deg AOA � big deal! � you are still well stalled and although the descent would have been shallower the end would have been the same unless he had recognised early on that he was in a stall.