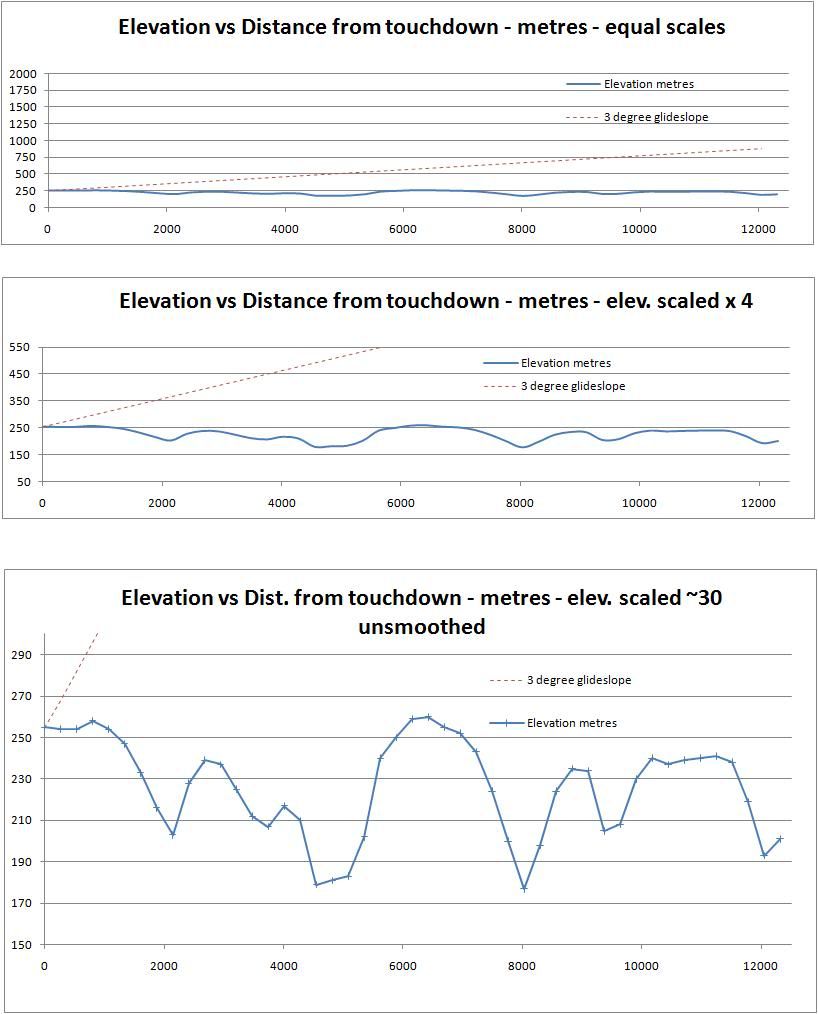
Here is a plot of the cross section data from Google Earth that I posted the other day.
For details of method and data source see post 144.
http://www.pprune.org/rumours-news/4...ml#post5723588
I have plotted three scales, 1 to 1, x4 vertical and about x30 vertical. Scales are approximate, if you care use the raw data. I also put in a 3 degree "glideslope". Note that the reference point is an assumed touchdown point 400 meters from the runway end. I selected it partly because it is at a junction with a taxiway and is therefore easily referenced.