This image might help to illustrate what
Dave Therhino and vilas are explaining.
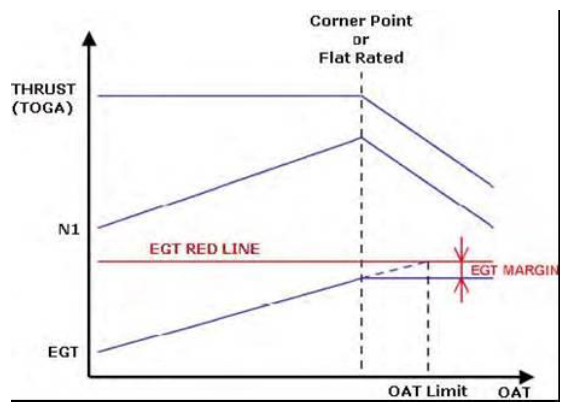
The figure above shows that the N1 is increasing with increasing OAT to the Corner Point. The EGT is consequently increasing to the Corner Point to remain constant beyond it. The margin to the maximum EGT-value (Red Line) is also displayed.
The EGT Margin is the difference between the EGT Red Line and the EGT observed on an engine at TOGA with a temperature greater than the Corner Point OAT.