Update for 8 Feb. Total number of cases:
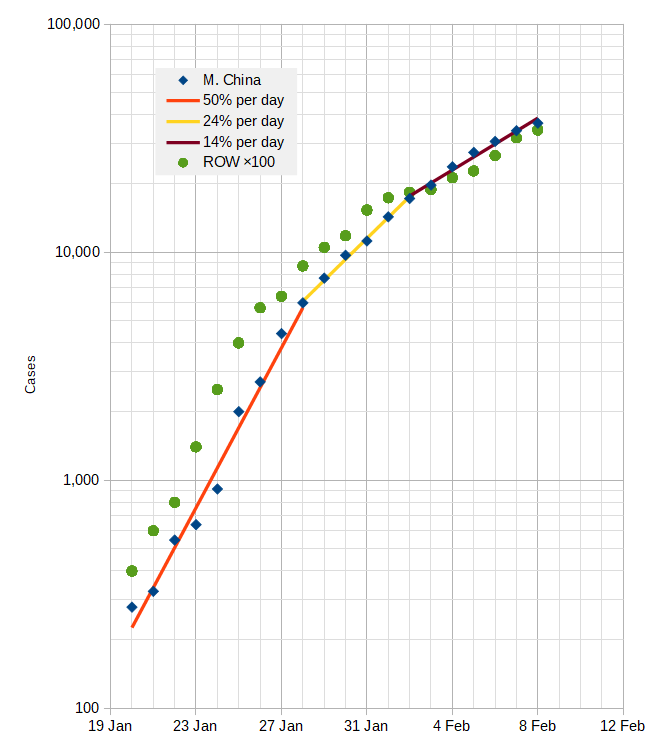 "Cases" are number of cases reported in mainland China (M. China) and rest of the world (ROW), from John Hopkins University.
Y-axis is plotted as a logarithm, so straight lines on graph show the exponential rate.
Coloured lines on chart are lines of best fit to mainland China data showing the daily increase in number of cases.
The rate of increase each day:
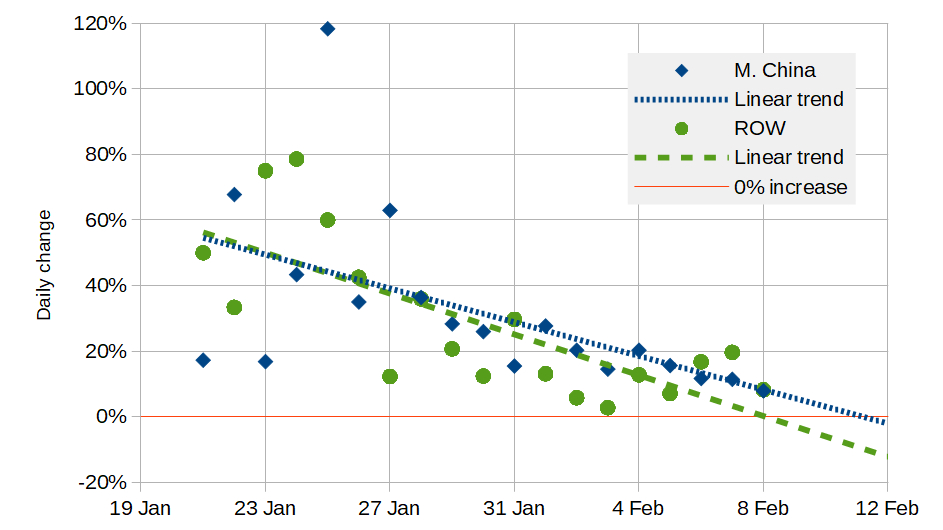 "Daily change" for mainland China (M. China) and rest of the world (ROW), from John Hopkins University.
Coloured lines on chart are linear lines of best fit.
Lines extending beyond data points are extrapolated and therefore not data-based but are speculative.
The rate of increase each day is trending downwards which is good. Overall the trend for mainland China matches the trend for the ROW pretty closely, with the total numbers in the ROW being about 1% of the mainland China numbers. If there is under reporting in either series it is either (1) too small to notice or (2) both series under-report by the same proportional amount.
The reduction in daily increase is significant. For example, had the initial trend of 50% per day increase continued to today, there would be about 485,000 cases in China and about 4,800 cases in the ROW, whereas the actual numbers today are about a tenth of that. So major strides have been made to contain the spread of nCoV so far.
Will we get to zero growth on or about 12 Feb? I've been doing these graphs for a while now and the extrapolation on the daily change graph has consistently crossed the zero line on 12 Feb (graph on
7 Feb,
6 Feb,
3 Feb). Today I read
this article which says in part:
Trends in reported cases in Wuhan so far broadly support the mathematical
modeling the London School of Hygiene & Tropical Medicine is using to predict the epidemic�s transmission dynamics.�Assuming current trends continue, we�re still projecting a mid-to-late-February peak� in Wuhan, said
Adam Kucharski, an associate professor of infectious disease epidemiology, in an email Sunday. �There�s a lot of uncertainty, so I�m cautious about picking out a single value for the peak, but it�s possible based on current data we might see a peak prevalence over 5%.�
...based their modeling on a range of assumptions about the 2019-nCoV virus. These include an incubation of 5.2 days, a delay from the onset of symptoms to confirmation of infection of 6.1 days, and the risk of infection among the 10 million people who have been identified as more vulnerable in Wuhan.
Based on that, a prevalence of 5% equates to about 500,000 cumulative infections.
When they mention 5% prevalence they are talking about all those infected, not just those that are so sick they report to hospital and get tested (which is what the John Hopkins data uses). What is interesting is that their modelling also shows a
"mid to late-Feb peak" which means my guesswork of 12 Feb is at least ballpark. They would know much better than me, of course, so I make no claims that I am more right; quite the opposite, extrapolation is speculative, I say that in the footnotes below the graph.
So for the sake of all our aviation careers, perhaps the
"end of the beginning" is in sight...