representative acceleration
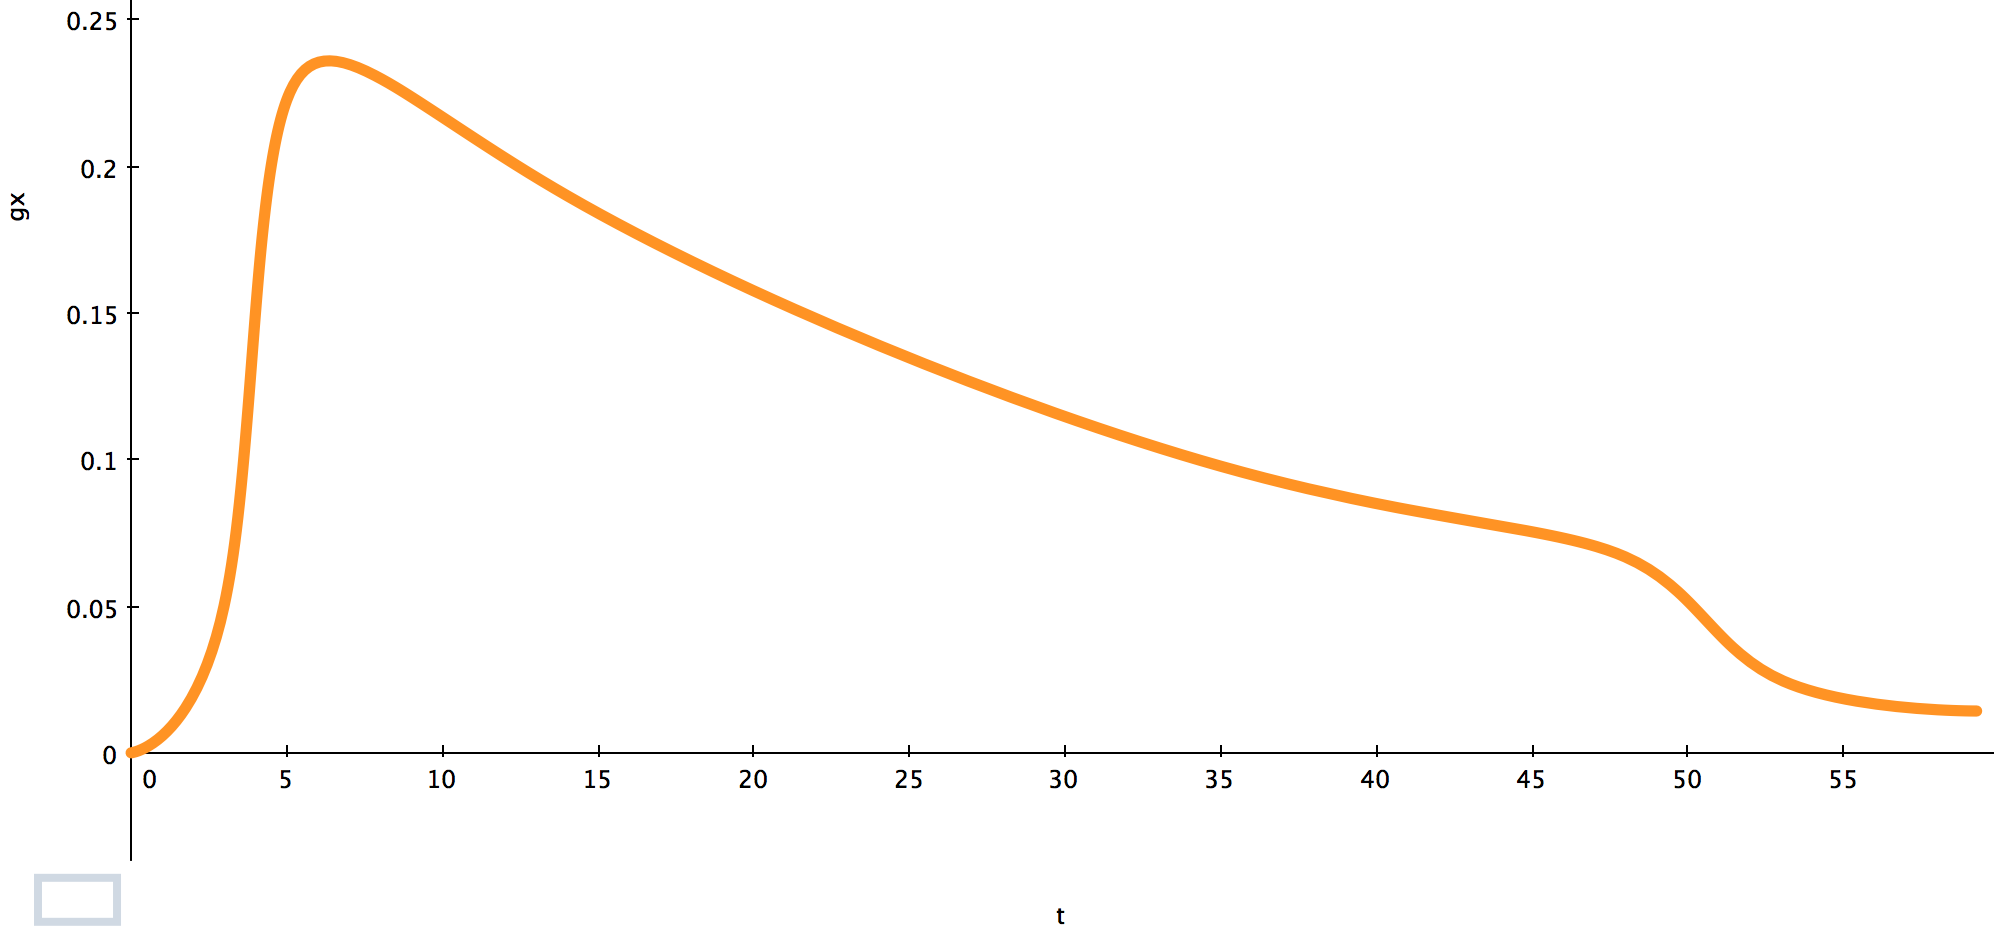
These are generic examples of TO performance, such as a heavy 4 engine aircraft achieves. The acceleration is from an actual aircraft with 4 blenders at limit weight, but values can be otherwise disregarded.
A TO acceleration takes a form of the following curve. The values change for each solution, but the curve follows the same form. If looking at the longitudinal acceleration value, at rotate, it increases with the pitch of the aircraft as it is recording total acceleration, so picks up normal gravitational vectors. The graph takes pitch related g out.
From acceleration data, rotate can be identified without pitch, (in fact if that is not done, it is very obvious, there is a spike in the acceleration as rotate occurs that has to be corrected for determining the position of the aircraft without GPS or GS. With GPS GS (and therefore position) the extent of change in HWC or TWC is readily identifiable, it stands out. A lot.
1. Excess weight lowers the curve peak and thereafter.
2. Dragging brakes alter the curve to the right of the peak
3. gradient alters the curve from the peak to the right side to rotate, either up or down, dependent on +/- slope
4. HWC reduces the curve to the right of the peak, and rotate will occur earlier for a steady HWC, opposite for a TWC.
5. shallow rotate will result in continued acceleration after rotate, increasing the last part of the curve upwards... (you get more CAS & GS)
With that information, any data plot shown post an event is pretty straightforward to evaluate and to find out where the issue arises from.
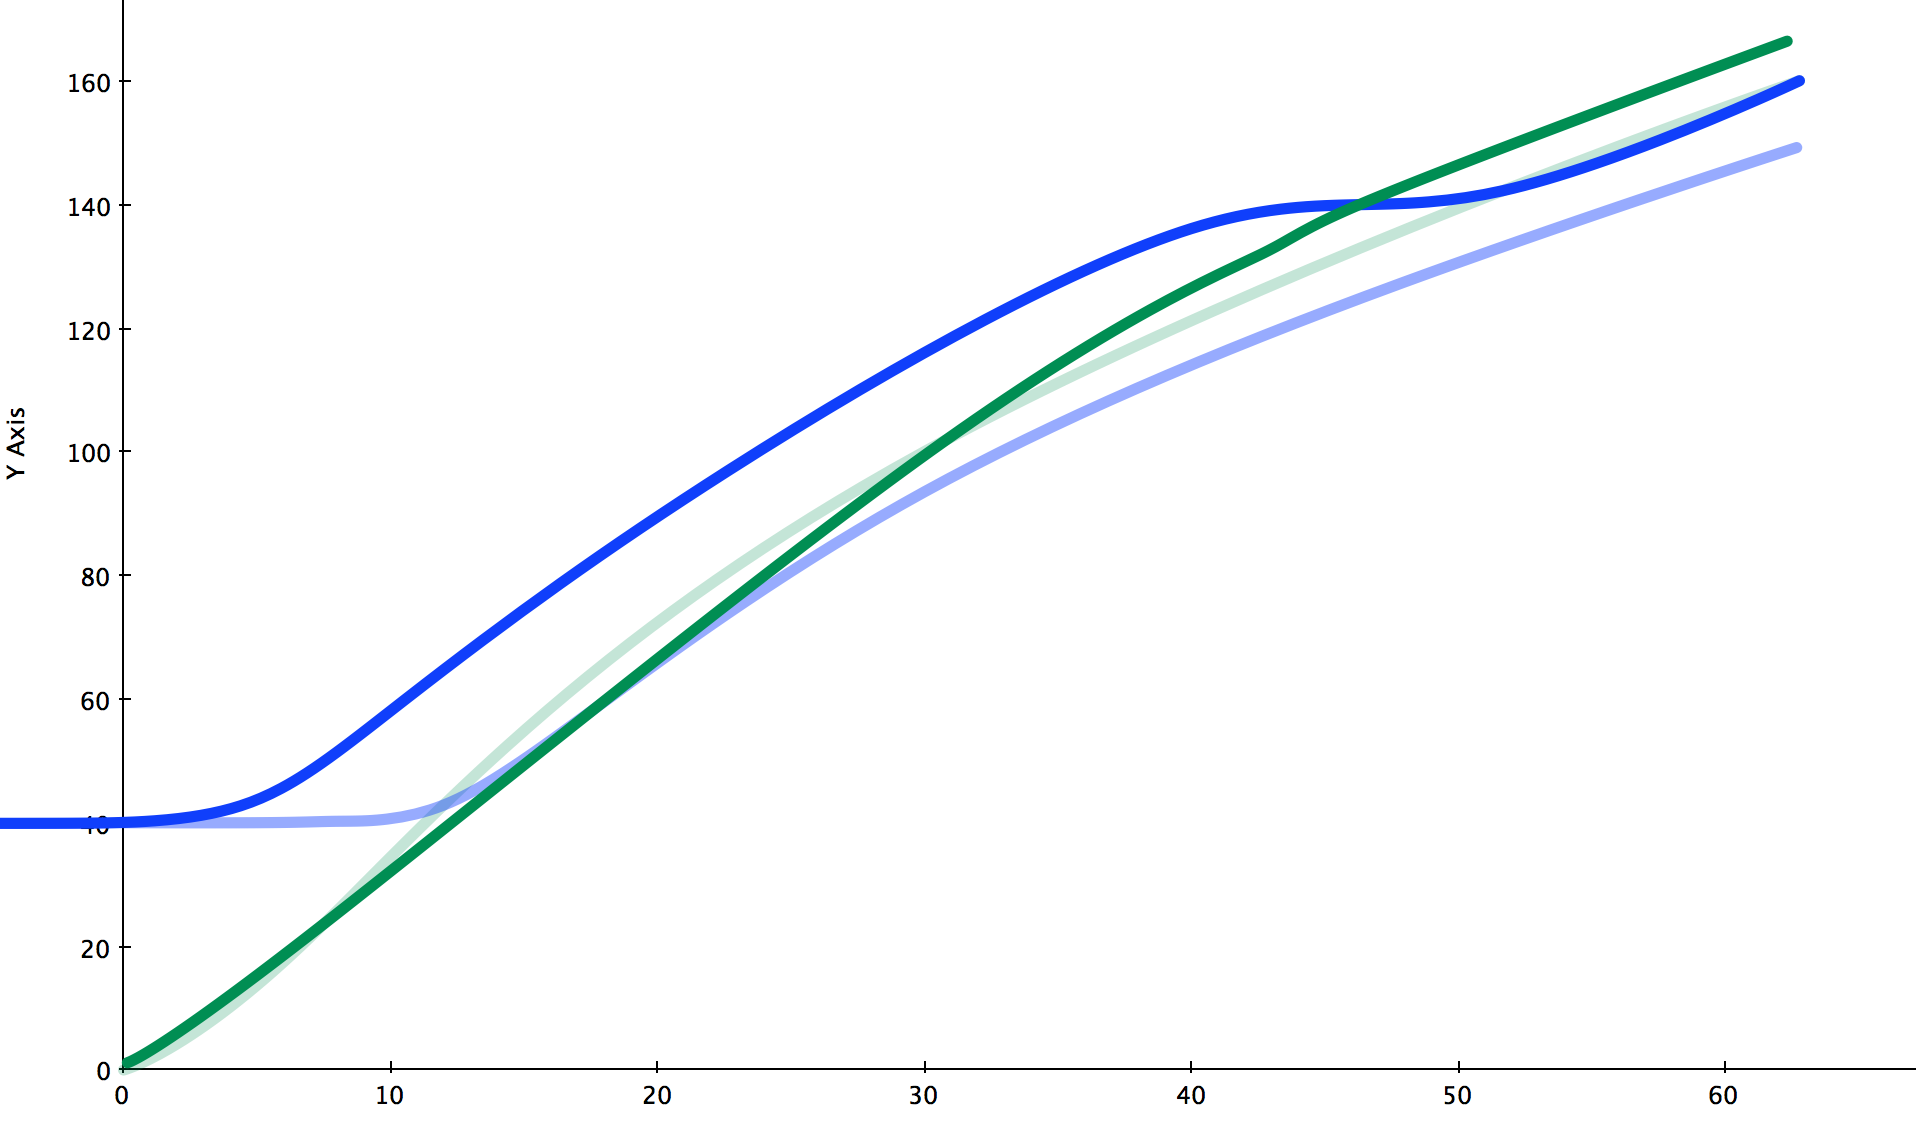
The following chart gives a comparison of data for a takeoff with calm conditions, (light coloured lines) and one with a 20kt headwind. On FDRs, the data captured by the 717 or 429 bus comes from an ADC source of some sort which has a minimum value for recording. The effect of TAS is noted in the difference between CAS and GS for the zero wind as well as the additional difference for the assumed steady headwind case.

A 20k wind shear, (undershoot, reducing headwind) is indicated below. It affects both CAS and GS lines, and the onset as well as the point where the conditions stabilise are identifiable. If the wind had increased again, then there would be an additional change in CAS, jumping up, and a slight reduction in the rate of change of CAS and GS thereafter.