Tim Vasquez, meteorologist in Texas here... weather data analysis is what I do for a living, and some of you may remember me from the
Air France 447 study about 10 years ago.
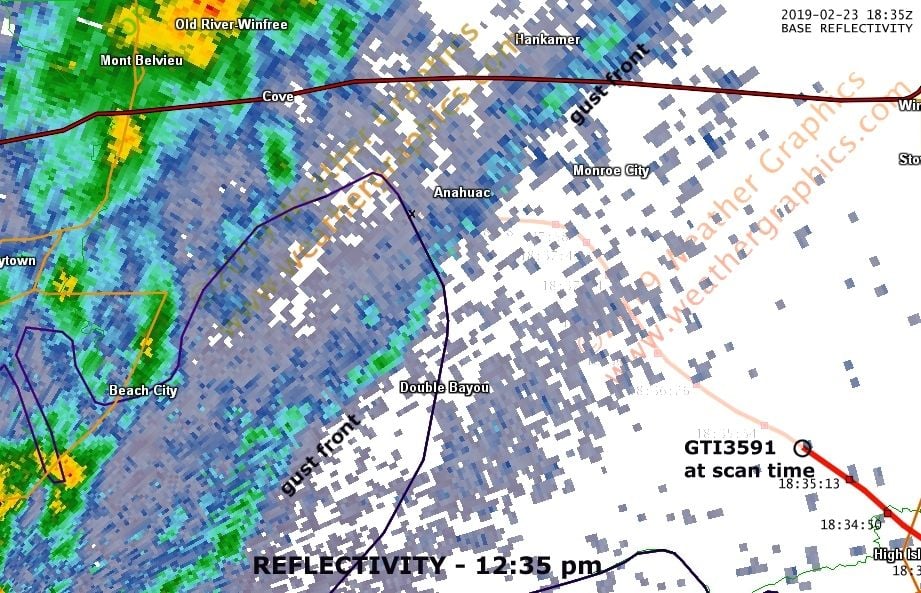
Regarding the 767 crash in Houston, a lot of images seem to be floating around that use default radar mosaics. These are problematic as they're focused on higher intensity levels, they are not very granular, they often carry an ambiguous scan time, and they're often built from composite products which are the result of multiple scans rather than a single scan. This makes it very difficult to use such data except to define the basic environment. In fact, I initially didn't think much of weather being a factor based on the preliminary images I saw. However I went ahead and accessed the raw WSR-88D base data files, which are for a single level and accurate to within about 1 minute, and I found some interesting stuff.
First of all, one caveat with these images: the ones I've posted here are built from 0.5-deg scans, which were underneath the 767 at a beam center altitude of about 2000-2500 ft and a beam width of about 2000 ft. I used these because there are usually a lack of scatterers at the higher tilts, and most of the convective circulations we see above 5000+ ft are initially generated near the surface. So there are indeed some assumptions about what is going on up at 5000 ft, where the problem presumably started. Time stamps are based on the
FlightAware track log, which comes straight from the ASDI feed. My assumption is these times are accurate. Sorry for the watermarks, I got burned back in 2009 by the media reprinting my diagrams commercially without permission.
A couple of conclusions:
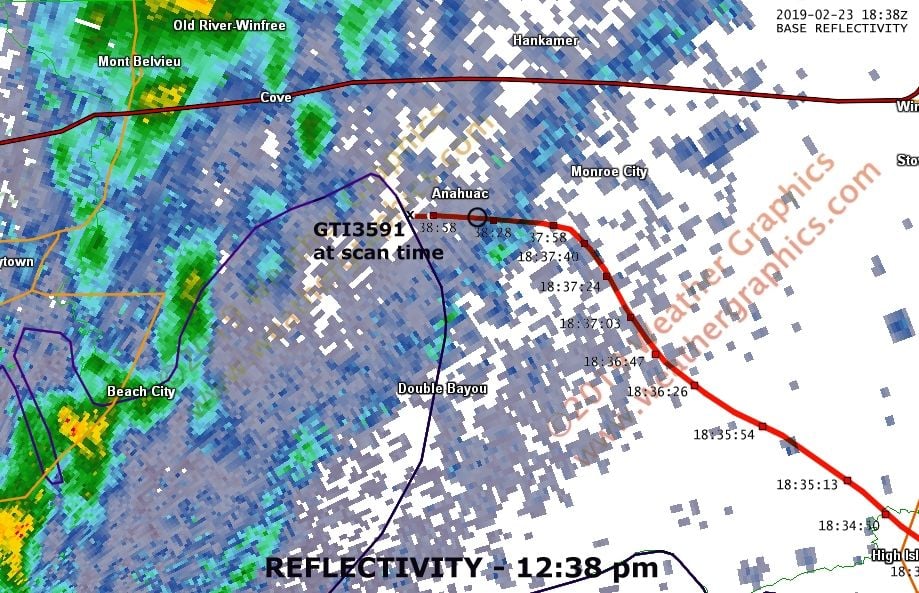
* A textbook gust front is clearly shown within 3 nm of the crash site. This correlation is definite and is striking.
* There were no thunderstorms within 5 nm of the crash site. There may have virga or weak showers though.
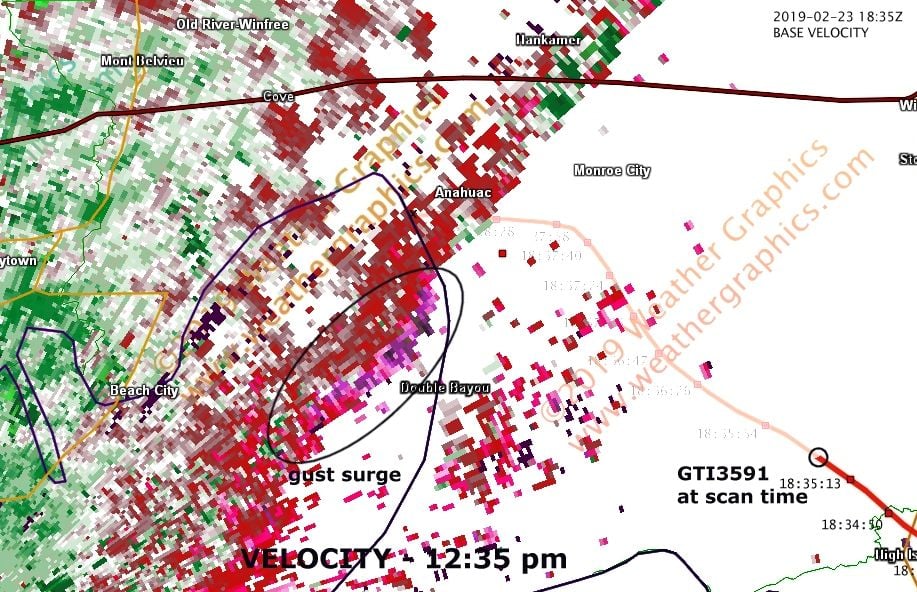
* It appears some sort of gust surge developed over northern Trinity Bay, lasting about 10 minutes, originating from the storms further west near Baytown, and it reinforced the gust front. This developed ground-relative motion of 50-60 kt along a band 6 nm long oriented NE-SW.
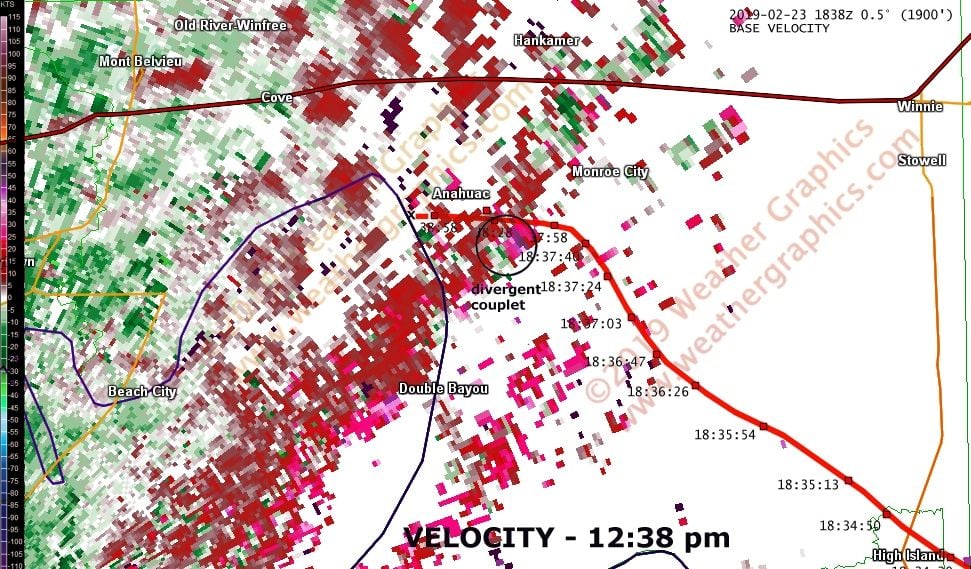
* Velocity product showed a transitory divergent couplet with 65 kt of shear within a 1 nm volume, slightly below and left of the track. This could be a piece of the northern edge of the gust surge. This is probably associated with turbulent motion, as the result of shear & friction along the frontal boundary.
* Velocity at higher levels (4000+ ft) and along the forward edge of the gust front are typically difficult to determine in these situations because a lack of scatterers.
* I don't think a gust front like this is anything that looks particularly dangerous. That said, it's impossible to directly measure turbulence, and in between the turbulence and cloud scales there are often strong circulations that can go undetected. Typically when we see small-scale patterns on radar imagery with strong gradients and circulation, we consider the possibility that strong motions can extrapolate down to the smaller scales. It's certainly possible that this gust surge rolled up into a vortex like I've shown in the cross-section below.. this can certainly be a hazardous area to fly in.
In short I'm skeptical weather caused a direct effect, but I do see enormous potential for a sudden, rough ride here, and that could have been the first event in a chain that led to something like a CG shift or loss of a control surface (from fatigue, improper maintenance, design issue, something like the 737 in Colorado Springs, etc).
It would be interesting to see what the TDWR radars showed, unfortunately as I have to attend to my other work I probably won't have time to look at this.
Anyway this is just an armchair analysis and I'm sure the investigators have more information at this point than we do, but it's nice to have quantitative data to work from.
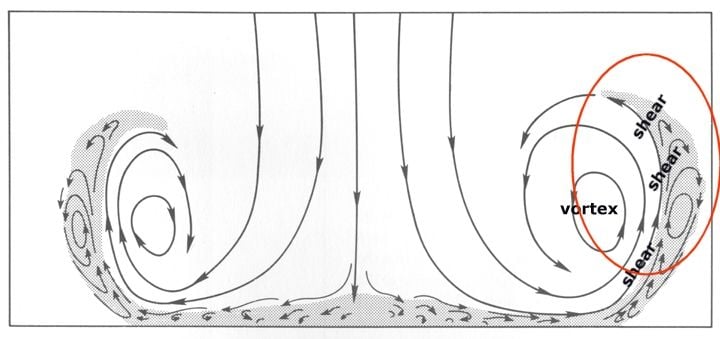
Conceptual vertical cross section of air flow along a gust front ahead of a microburst.