


A340 Rotation Problems

Thread Starter
Join Date: Nov 2015
Location: Paisley, Florida USA
Posts: 289
Likes: 0
Received 0 Likes
on
0 Posts
fdr;
Thank you very much for your analysis of these high altitude takeoff events. I may be totally mistaken here (it's a LOOOONG time since I've done any dimensional analyses), but your formula for Rate Of Climb (ROC) seems to be for linear acceleration, not ROC. In my opinion, you are, however, correct in your analysis that the dicey takeoffs in question featured both very low climb rates and low airspeeds. This sounds like inadequate acceleration per your equation. To perhaps over simplify, inadequate acceleration is usually due to either inadequate thrust or too much weight or a combination of both. As I stated, and to help in my understanding by maybe oversimplifying, I have omitted considerations of rolling resistance, aerodynamic resistance, guano accumulations etc. At any rate, your point that perhaps either the aircraft manufacturer or the operator, or both, are overly optimistic in their performance calculations, is valid in my opinion and may be the root cause of the subject incidents.
Which leads me to UltraFan's post. Are the flight crews using all available power, or are they only using partial takeoff power settings for some obscure reason?
At this point, considering both fdr and UltraFan's posts, I tend to agree that there may be inadequate (inaccurate?) performance data being furnished by both the manufacturer and the operator.
Just my relatively uninformed opinion.
Cheers,
Grog
Artificial Runway Length...
Capt'n;
That is true, to have inadequate speed at the end of the roll comes from either being heavier than expected, or having less thrust than expected. Additionally, it is possible that drag is higher than expected, such as from a dragging brake. In the early days of jet ops, that could be the case, but today, most aircraft of note have brake temperature monitoring, and that will detect a cause from an dragging brake.
For excessive weight, there are other effects; climb and cruise will be adversely affected. The climb performance decrement may not be discernible to the crew unless they are well aware of the performance of the aircraft, and where there is no external factors such as wind gradients or temperature variations from the normal expected conditions. The cruise however is the simple proof of unknown weight changes. SKBO to LFPG is around 4666nm GC, and 4753nm by the minimum time route today... At M0820, that is currently about a 10:00 flight. Over 10hrs, an aircraft is going to burn about... 30% additional fuel for every kg overweight. For the event takeoff, the effective weight overload to achieve that outcome is about 15T (very roughly). That would equate to an excess fuel burn of 5 Tons, if the performance loss was dependent on excessive weight. If all of the takeoff events were due to overload, then there would be a historical record of excessive fuel from all of the excess coffee beans etc... use of average weights with sumo wrestlers etc... Love or hate EASA, weight control is substantially better than most other jurisdictions, and more than a one off is unlikely to happen often. Without the data, and the flight plan, it is still safe to assume that an extra 50 odd minutes of fuel burn would have stood out and comment would have been made.
Engine performance is monitored by the airline. Representative records of A340-300 and 600's show that a shortfall of thrust would be discernible by any casual analysis. The data captures the PT2 inlet conditions, and that would have given an immediate cross check of the ambient conditions that the crew made their takeoff assumptions on, e.g., was the airmass at the engine intake substantially different to the reported "air temp" on the ATIS. That data would be interesting to look at. I wager it will never be made public. If heat soak of the runway results in a difference from the conditions that the performance was predicated on, then the question becomes what was measured or corrected in certification... does the analysis end up with an introduced error. Wind changes are the main variable that comes to mind, and certainly can affect TO performance. The most limiting case is always calm conditions, the buffers of factoring are absent in that case. The rough back of envelope analysis of the effect of wind is that you would need about a 30-35kt adverse change to get a 15 ton error, or otherwise be missing the IAS that exists in the event. That is a considerable amount of change. evaluating change on a TO roll is simple where there is CAS and GS values recorded. Additionally, using the accelerometer values corrected for pitch gives the underlying performance of the aircraft. charting these gives a glaring display of any changes. To consider the effect of wind change, look at the Vexpected-Vactual, and divide by the average acceleration in kts/sec, or more accurately, the rates associated with the point where the velocity/time graphs alter from the curve. (in a wind change, IAS will change from the existing curve, as will GS, but in opposite directions... pretty obvious on the chart or even in the data file when converted from hex to engineering units. Acceleration rates reduce smoothly to a minimum at rotate, following a 2nd order poly curve for the latter part (the whole curve is 6th order with limits... having 5 inflections and ending near asymptotic).
The 200m offset is a reasonable start, but is inadequate to the 990m excess runway length used by the event aircraft. The change should be rather more generous, but anything is better than nothing. It remains the case that the slow rotate is apparently considered to be causal rather than consequential to a performance decrement.
In simple terms, of you are within 15-20 tons of your limit weight, at high weights, (above MLW etc... getting up towards MTOW) then be very careful about waste of runway and your figures... Your FCOM and FCTM will include sage advice on what to do in the event of a wind shear, which is IMHO applicable for the gross underperformance case, the main observation that a crew will get of wind shear is a change in performance, such as stagnating speed, rapid rise in speed over expected etc... The BEA report gives AI's test rates of 4 seconds to liftoff... from first control input, so that is 4s x GS/s... say 4 x 80m/s... and of course you are doing this because of low speed etc, so for every 5 kts below Vr, the attitude at liftoff will be about 1 degree higher, if you have that amount of room at the tail, and that is also another 80m... Vmu lurks below these speeds, being a Vr=1.1Vmu for AEO, 1.05Vmu for OEI where not geometry limited, or 1.08/1.04 for geometry limited aircraft, like the 340, and that pretty much limits your minimum flying speed to liftoff, and your likelihood to end up as a chicken farmer. Abused TO rotate is Vr-5. The good news is that most times we don't get the entertainment of a total and sudden loss of thrust of a blender at V1-1s, and all that happens is that there is a new conversation subject at the bar. If you do have the event type performance, and a birdstrike, then your day may end badly, irrespective of clean living, Chuck Yeager skill sets etc... your well being, and that of your punters is dependent on the random flight path of an african swallow intersecting the compressor inlet flow of one of your 4 hair dryers, etc.
Don't waste runway when heavy... and don't hit birds near V1. Apparently clean living and religion are adequate defences.
P.S.: The BEA investigation highlights that it is straightforward for airlines with modern aircraft to gain useful data on performance from their FDM system. Most will have triggers for events for pitch change before rotate speed, low speed liftoff, etc. It is simple enough to ascertain the crossing height at a screen point as an assurance of underlying performance and RTOW analysis validity, but AFAIK, none do, the consequences may be to change the operational limitations and that hits bottom lines, but it is what the punters pay for, and what the continued airworthiness of the aircraft (compliance with the TC) requires.
Last edited by fdr; 13th Jul 2019 at 02:29. Reason: PS:
Join Date: Jul 2014
Location: Germany
Posts: 344
Likes: 0
Received 0 Likes
on
0 Posts
FDR:
I'm curious, why can't a slow rotation be a contributing factor of bad performance?
Especially with 4 engines and a limited amount of excess thrust.
Before rotation, lift induced drag is at a minimum but you have rolling friction.
After rotation rolling friction is eliminated.
So during rotation you have more drag, isn't that fair to say?
If you combine that with very limited excess thrust, wouldn't the acceleration be minimal during rotation?
So i could imagine that during rotation the aircraft isn't able to accelerate beyond a certain speed, or at least not effectively.
Thus you wouldn't gain almost any energy during rotation.
Maybe for thrust to be that limiting, it's already well below what is required, i don't know.
A very detailed graph of speed and acceleration during takeoff would sure be interesting.
Fair point.
TO an extent that is true, during the rotate itself, the down force from the tail results in an increased induced drag directly, and a slight increase in the weight on wheels over the time between rotate and liftoff. In the incident, on p78, the report gives the GS throughout the rotate, and it is a gentle curve, showing no abrupt loss of GS. The discussion of the report gives the rotate speed, and states the CAS that occurred at liftoff, and they indicate that acceleration continued throughout the rotate, so there is no massive reduction from the induced drag from the elevators, or the increased load x time for the gear rolling along the runway.
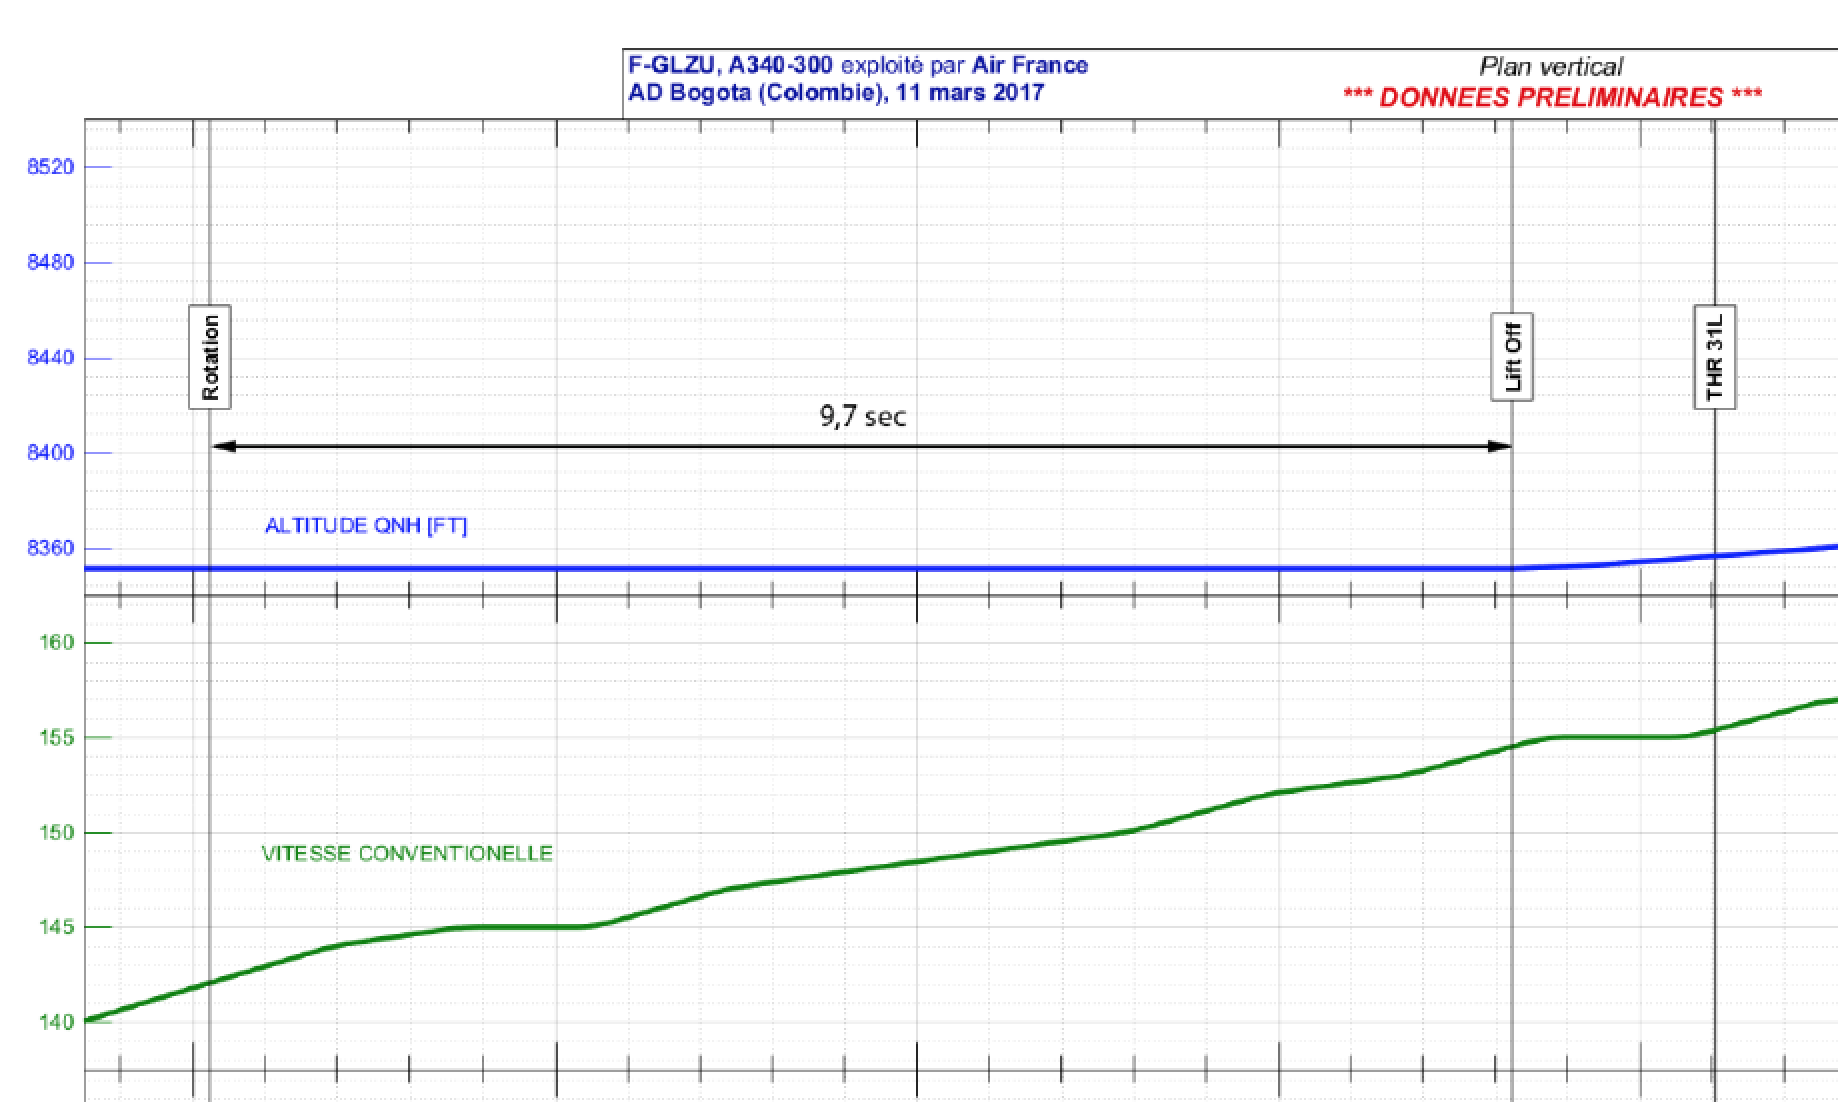
Consider the following. as far as TOR is concerned, the BEA report on p36 states that the AFM gives a distance of 3154m, vs the actual event requiring 3960m. 806m difference. The GS increases from 142 to 155kts, for an average (it was recorded as being a nearly linear regression) of 147.5kts, or about 75.9m/sec. liftoff took 9.7 sec after Vr, at a CAS of V2+9. The TOD of the AFM gave 3318m, which is about 800m margin for a limit takeoff, which is great, the event aircraft used up 4305m, 205m more than the TODA... to get to 35'. Without a failure.
The slow rotate doesn't result in any loss of speed gain, it continues throughout the event, but is not excessive, it is within normal targets by the time the plane gets to 35', the height just happens just under 1000m beyond where it would have been for the expected performance, and 200m approximately outside of the absolute limit of the engine out case. Traversing the excess 1000m that it took takes time, about 13 seconds, yet the rotate was only about 4-5 seconds longer than normal, and if speed had been building as a consequence of the shallow rotate, then the liftoff attitude would have been at a lower pitch and higher speed, but less than the error time to attain the normal rotate attitude. The time difference between the AFM and event rotates, equates to about 300-375m increase in distance, which leaves around 625-700m unaccounted for.... doing 75m/sec... is about 9 to 10 seconds of acceleration... at 2.5-3 m/sec average, as commented previously about a missing 25KIAS from some unknown cause. Wind shear? Nope, no change in CAS(TAS)v GS... temp? maybe... overweight? unlikely, unless they had some 5 tons of spare gas to lose enroute without comment.
A LH 333 did clip its tail out of KORD on 5 Mar 2013, having achieved an instantaneous pitch rate of 4.2 degrees/sec, Even with a rotate fast enough to whack the tail, at q3.5 degrees ANU, and with a speed increase in the snatch flare of 14KCAS. 333s way outperform the 343 at any time. Somewhere in between these rates is a nice medium, but the missing performance remains.
Last edited by fdr; 13th Jul 2019 at 09:39.
Join Date: Nov 2003
Location: Germany
Posts: 137
Likes: 0
Received 0 Likes
on
0 Posts
Hi, fdr,
could you please explain why you exclude a wind change from considerations ?
Used to be that introducing a tailwind into takoff-calculations carried a substantial penalty in terms of possible t/o weight.
Having unforeseen and thus uncalculated winds = possibly, a huge takeoff problem.
How was the acceleration from brake release/ start of takeoff roll to the point where rotation was attempted ?
I don�t speak french, thus can�t understand the report.
Thanks.
Hi, fdr,
could you please explain why you exclude a wind change from considerations ?
Used to be that introducing a tailwind into takoff-calculations carried a substantial penalty in terms of possible t/o weight.
Having unforeseen and thus uncalculated winds = possibly, a huge takeoff problem.
How was the acceleration from brake release/ start of takeoff roll to the point where rotation was attempted ?
Tail winds do give a severe penalty to TO performance, in actual outcome and calculation. The calculation takes 150% of the component as the effective wind, providing a buffer for error.
How was the acceleration from brake release/ start of takeoff roll to the point where rotation was attempted ? That is the right question, and the answer is given in the report, yet gets no weight. The crews rotate rate was slow, no doubt about that, but they didn't get an excessive IAS as a result so something was going on. The report on p36 gives the distances for TOR, and notes an excess of 806m for the event, yet the rotate was only 9.7s from rotate to liftoff, vs between 4.5-5 s for the certification case. That is about 5s at... 75m/s, which is less than 806m by an amount that has not been accounted for. That is part of the performance error, and it speaks as well to the point:
On any takeoff that fails to achieve an appropriate screen height including the amount additive for not having the engine failure in normal operations, the reject case has been compromised to some extent, which is identifiable in the recorded data, but no carrier bothers to track that data to assure continued performance. Pretty large Ooops.
The sensor data is available to record the location on the runway where various events occur, just as in the report, and there are specific points where they much occur to meet the certified performance of the aircraft. Looking at the data closely is not a negative to the carriers, it would indicate where issues exist that need to be taken account of, such as wind changes, or erroneous temperature info, but verifying the outcome would increase safety margins. It is also possible that monitoring the performance will detect weight errors of the aircraft, and where performance is actually better than schedule (it does happen, just not often). The performance is originally based on degraded engines and brakes etc, and would a suitable equivalent safety case, one could argue (might even be successful) in optimising the performance based on actual. Hard sell, but it is a selling point to the beancounters as they have less interest in operational safety alone.
Very interesting and fascinating read... if somewhat scary.
In your opinion what is the root issues here ? did Airbus publish significantly too optimistic figures or is are some specific airframes not performing (both not being mutually exclusive of course) ?
In your opinion what is the root issues here ? did Airbus publish significantly too optimistic figures or is are some specific airframes not performing (both not being mutually exclusive of course) ?
The sidestick issue helped save Emirates Airlines Airbus A340-500, registration A6-ERG performing flight EK-407 from Melbourne. The pilots entered the wrong weight for a FLEX takeoff and the plane was at the wrong speed for takeoff at that weight. They just pulled all the way back, the tail dragged on the ground but as soon as it got to takeoff speed up it went at the best angle possible. Swings and roundabouts I guess.

I don't think scary is the right adjective, the issue is one of awareness or more importantly lack of awareness, and the assumption of risk without knowledge. The 340 has been around for... a looooong time, and the performance issues have been observable form day one, yet it is a headline that in 2019 an operator adds a margin for questionable performance. How many passengers have done limit takeoffs that the crew have not reported, and which result in compromised safety? How great is our industry that this remains the case. What has been the exposure that has needlessly resulted as collectively we either don't care, or don't recognise, or are unable to confidently report issues. The 340 is a quite glaring example, but not the only one that has existed. There is one that has a 40 year history that has been denied, and the gold plated airlines that tout their excellence behaved in a manner that is unbecoming, and caused irreparable harm to those that attempted to rectify the problem, to reduce the risk to the very officers that behaved in unconscionable ways.
Performance issues will arise, that is the way of a dynamic system, but habitual underperforming is not something that passengers are expected to be exposed to. The industry reminds me of the emperor with no clothes; we hear the words Safety, Compliance, Just Culture, from the same groups that have used gag orders to conceal issues. We will have turned a corner when a QA engineer finding parts being fabricated by hand when the design requires that they be CNC milled is not victimised by the worlds greatest OEM, when crew reporting issues don't lose their jobs as a result of compliance with the underlying law of the land, when managers discharge their duty of care in a manner reflecting integrity. The military generally had a better safety culture, however it is certainly not immune to issues of integrity, My Lai, killing of Namir Noor-Eldeen and Saeed Chmagh, the Reuters photographers, 12 July 2007, Baghdad, where the cover story sold to the US Public was that they were insurgents. Joe Biden calling thereafter for the extrajudicial punishment of Assange for releasing the leaked AH64 gun tapes just topped off the integrity of the system, so much for the Constitution.
Aerospace relies on integrity, but the system observably and routinely acts against it's own interests.
4 pot planes are most obvious in general problems, but the 380 seems to perform admirably. All the others are not so much... 2 holers should have lots of spare on a normal day, yet that is not always the case, and when it is obvious from the cockpit, you probably have had a severe failure of performance. Don't build markets off the end of runways where former CIS aircraft depart, it can end in tears.
Thx fdr for your excellent elaboration.
I flew the 340 for about three years and heavy T/Os have always raised my blood pressure. However it was just a feeling and there was not much I could have done about it.
Interesting that the regulator(s) FAA, EASA are obviously putting their head in the sand and are just relying on manufacturer data....., like 737max disaster
Join Date: Dec 2010
Location: MC80 Home One type Star Cruiser
Posts: 192
Likes: 0
Received 0 Likes
on
0 Posts
The sidestick issue helped save Emirates Airlines Airbus A340-500, registration A6-ERG performing flight EK-407 from Melbourne. The pilots entered the wrong weight for a FLEX takeoff and the plane was at the wrong speed for takeoff at that weight. They just pulled all the way back, the tail dragged on the ground but as soon as it got to takeoff speed up it went at the best angle possible. Swings and roundabouts I guess.
https://aviation-safety.net/wikibase/wiki.php?id=147120
Thread Starter
Join Date: Nov 2015
Location: Paisley, Florida USA
Posts: 289
Likes: 0
Received 0 Likes
on
0 Posts
I'm beginning to suspect that the Airbus "Reduced Flexible Thrust" procedure may have had a role in A340 white knuckle takeoffs. While input of aircraft gross weight should be somewhat straightforward, other variables such as actual temperature wind etc. may be more complex. How sensitive is the Flex Thrust program to input errors? What percentage of maximum thrust available (TOGA) was being used in the Bogota takeoffs?
Cheers,
Grog
Cheers,
Grog
It didn't really matter... Even with full blast it was adrenalin pure.
You may have a point, on the validity of the data above tested temperatures. If the data was accurate, then doing a takeoff at an assumed temperature well above ambient removes the variable of temperature error for the actual condition, replaced with the question of the accuracy of the assumed temp performance. The engine thrust output for a given temp is straightforward to determine, so the values should be reasonable, and would have been possible to measure for accuracy using an assumed temp, and correcting for the difference of actual vs assumed TAS.
Join Date: Nov 2003
Location: Germany
Posts: 137
Likes: 0
Received 0 Likes
on
0 Posts
Ah, I understand now, Thanks for the info on the takeoff roll ISA/GS .
Otherwise, memories ...
In the 747-200 freighter, you knew where the runway end was and how it looked: that�s the fast approaching line of red lights....
This sight returned only rarely in the later model 747s...
Yes, there seems to be a performance / certification issue here with that A 340....
Otherwise, memories ...
In the 747-200 freighter, you knew where the runway end was and how it looked: that�s the fast approaching line of red lights....
This sight returned only rarely in the later model 747s...
Yes, there seems to be a performance / certification issue here with that A 340....
If you had coaming cutoff of the departure end of runways touchdown zone markings before you got to Vr, then you were fortunate not to have had an engine failure. With the lights as reference, that would be the commencement of alternating center line lights. Thats roughly the geometry incorporating sight cut off geometry etc.
The -400 was better than the -200 or -300, and the -200 wet TO's were as often as not just awful, without any water pump failures. 2 notable wet takeoffs that I observed were one without failure where ATC sent a vehicle to check the perimeter fence. On another, with failure of one pump at 80kts, we were very glad the mangroves had been trimmed off the end of the runway.
curves: my last post on this topic
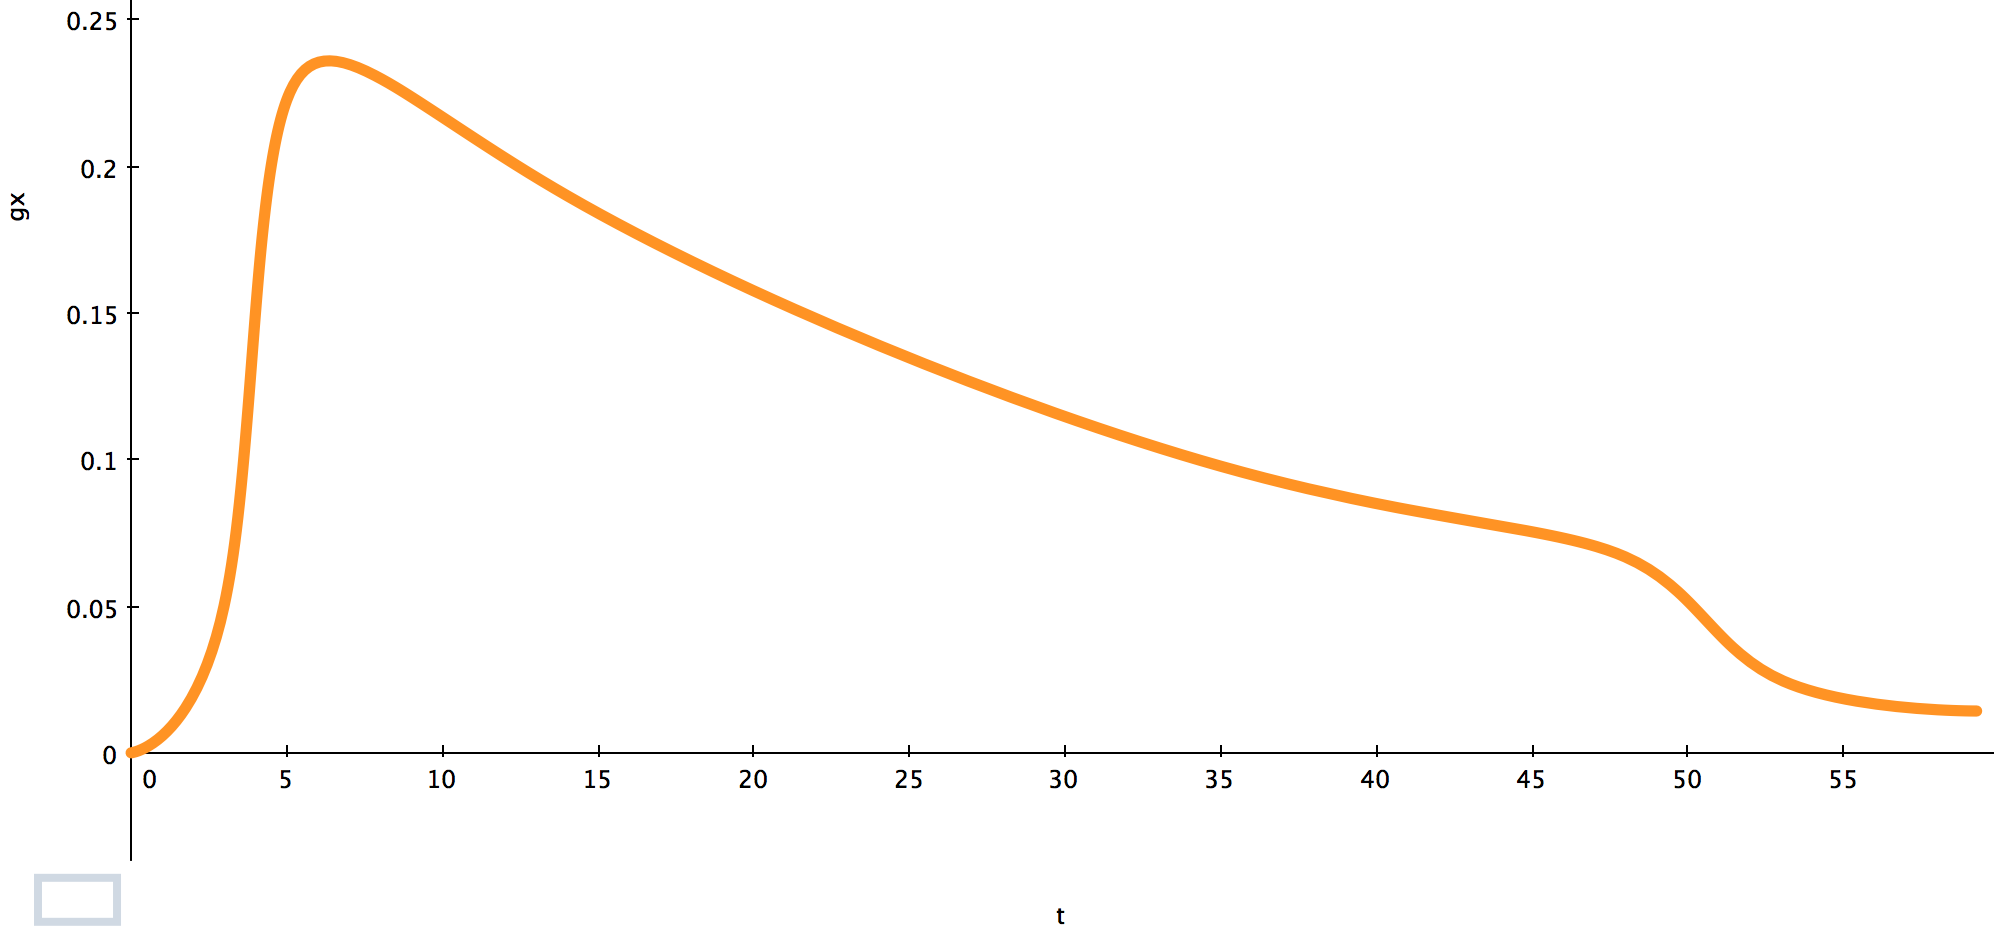
representative acceleration
These are generic examples of TO performance, such as a heavy 4 engine aircraft achieves. The acceleration is from an actual aircraft with 4 blenders at limit weight, but values can be otherwise disregarded.
A TO acceleration takes a form of the following curve. The values change for each solution, but the curve follows the same form. If looking at the longitudinal acceleration value, at rotate, it increases with the pitch of the aircraft as it is recording total acceleration, so picks up normal gravitational vectors. The graph takes pitch related g out.
From acceleration data, rotate can be identified without pitch, (in fact if that is not done, it is very obvious, there is a spike in the acceleration as rotate occurs that has to be corrected for determining the position of the aircraft without GPS or GS. With GPS GS (and therefore position) the extent of change in HWC or TWC is readily identifiable, it stands out. A lot.
1. Excess weight lowers the curve peak and thereafter.
2. Dragging brakes alter the curve to the right of the peak
3. gradient alters the curve from the peak to the right side to rotate, either up or down, dependent on +/- slope
4. HWC reduces the curve to the right of the peak, and rotate will occur earlier for a steady HWC, opposite for a TWC.
5. shallow rotate will result in continued acceleration after rotate, increasing the last part of the curve upwards... (you get more CAS & GS)
With that information, any data plot shown post an event is pretty straightforward to evaluate and to find out where the issue arises from.
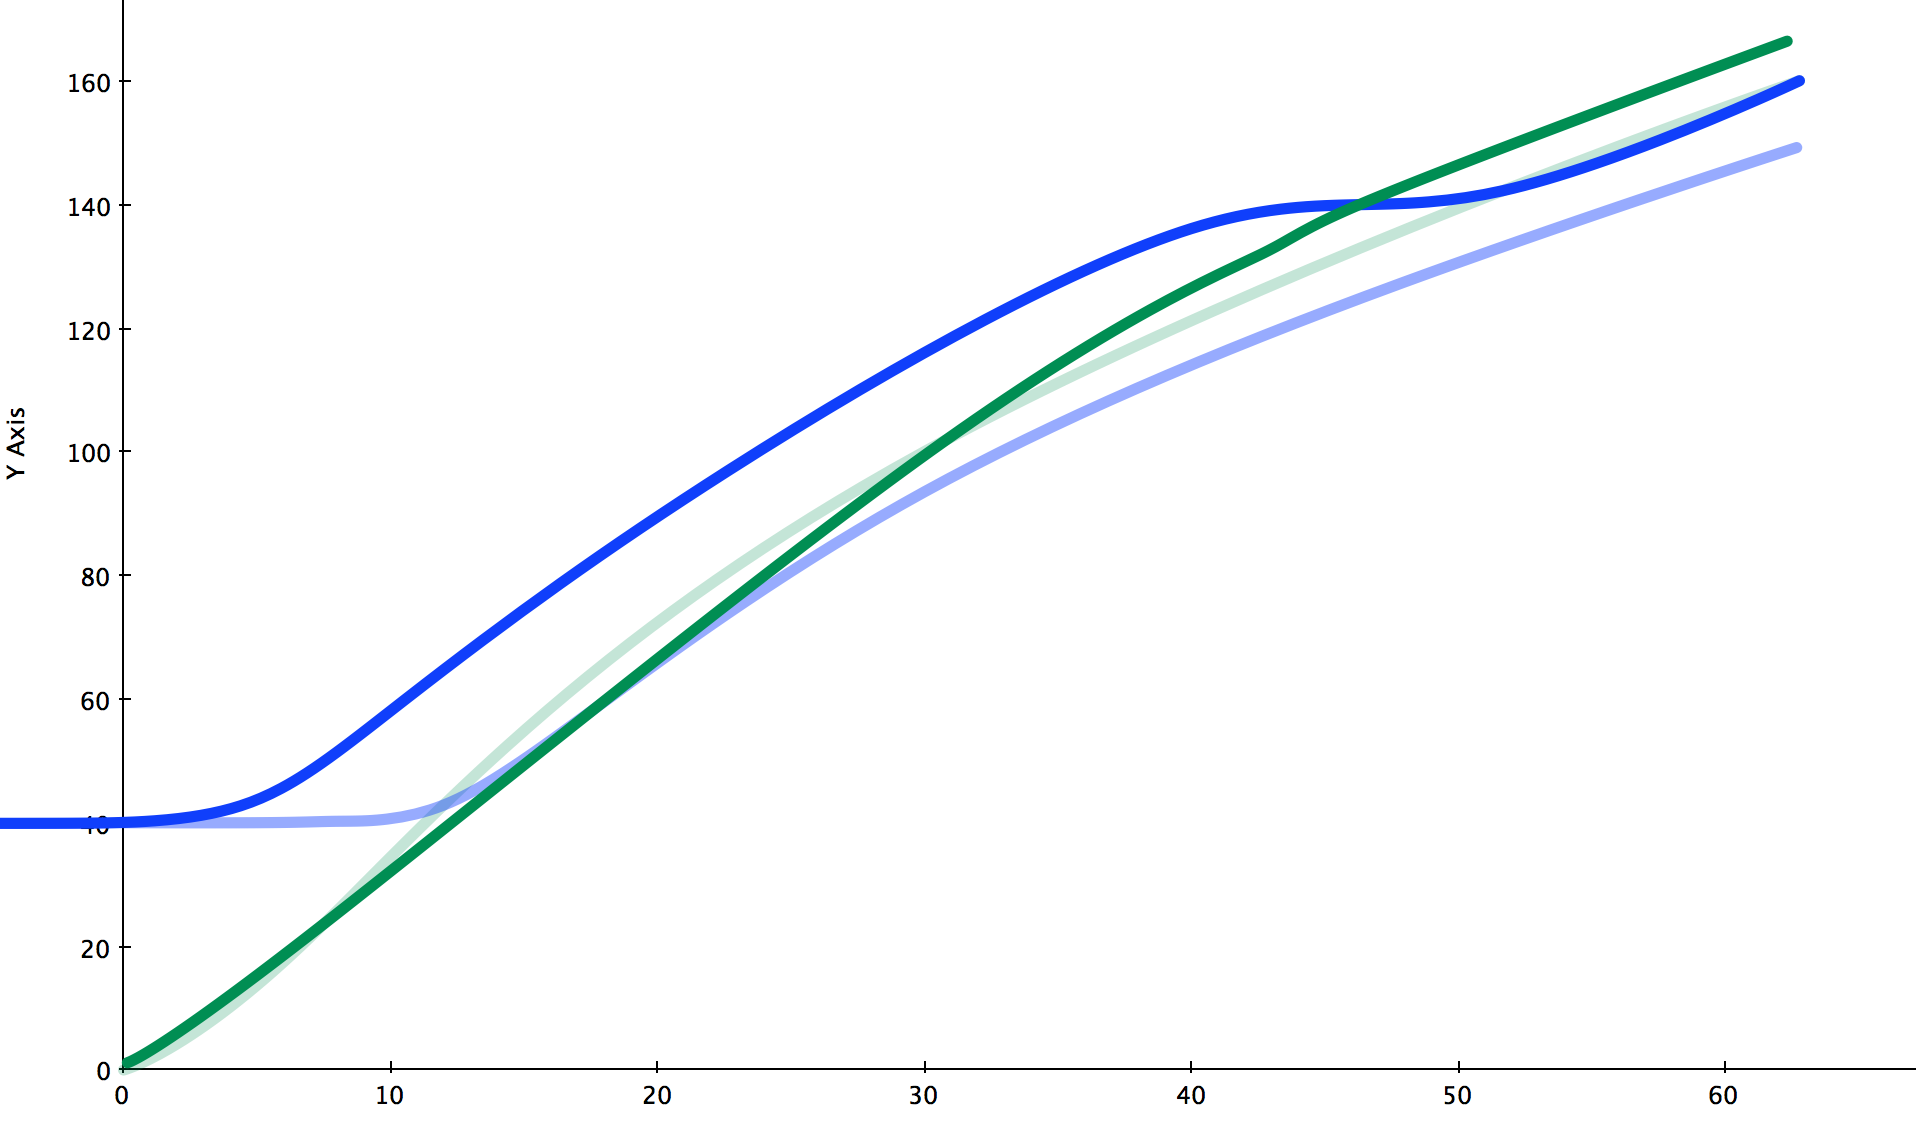
The following chart gives a comparison of data for a takeoff with calm conditions, (light coloured lines) and one with a 20kt headwind. On FDRs, the data captured by the 717 or 429 bus comes from an ADC source of some sort which has a minimum value for recording. The effect of TAS is noted in the difference between CAS and GS for the zero wind as well as the additional difference for the assumed steady headwind case.

A 20k wind shear, (undershoot, reducing headwind) is indicated below. It affects both CAS and GS lines, and the onset as well as the point where the conditions stabilise are identifiable. If the wind had increased again, then there would be an additional change in CAS, jumping up, and a slight reduction in the rate of change of CAS and GS thereafter.
These are generic examples of TO performance, such as a heavy 4 engine aircraft achieves. The acceleration is from an actual aircraft with 4 blenders at limit weight, but values can be otherwise disregarded.
A TO acceleration takes a form of the following curve. The values change for each solution, but the curve follows the same form. If looking at the longitudinal acceleration value, at rotate, it increases with the pitch of the aircraft as it is recording total acceleration, so picks up normal gravitational vectors. The graph takes pitch related g out.
From acceleration data, rotate can be identified without pitch, (in fact if that is not done, it is very obvious, there is a spike in the acceleration as rotate occurs that has to be corrected for determining the position of the aircraft without GPS or GS. With GPS GS (and therefore position) the extent of change in HWC or TWC is readily identifiable, it stands out. A lot.
1. Excess weight lowers the curve peak and thereafter.
2. Dragging brakes alter the curve to the right of the peak
3. gradient alters the curve from the peak to the right side to rotate, either up or down, dependent on +/- slope
4. HWC reduces the curve to the right of the peak, and rotate will occur earlier for a steady HWC, opposite for a TWC.
5. shallow rotate will result in continued acceleration after rotate, increasing the last part of the curve upwards... (you get more CAS & GS)
With that information, any data plot shown post an event is pretty straightforward to evaluate and to find out where the issue arises from.
The following chart gives a comparison of data for a takeoff with calm conditions, (light coloured lines) and one with a 20kt headwind. On FDRs, the data captured by the 717 or 429 bus comes from an ADC source of some sort which has a minimum value for recording. The effect of TAS is noted in the difference between CAS and GS for the zero wind as well as the additional difference for the assumed steady headwind case.
A 20k wind shear, (undershoot, reducing headwind) is indicated below. It affects both CAS and GS lines, and the onset as well as the point where the conditions stabilise are identifiable. If the wind had increased again, then there would be an additional change in CAS, jumping up, and a slight reduction in the rate of change of CAS and GS thereafter.
Thread Starter
Join Date: Nov 2015
Location: Paisley, Florida USA
Posts: 289
Likes: 0
Received 0 Likes
on
0 Posts
Qestionable Finding of Pilot Error(?)
Having read as much as I could find on the Bogota A-340 events, it has become clear (to me anyway) that the BEA finding that "improper pilot practices" were the primary cause of excessively long takeoff runs at Bogota's airport is not correct. I have not been able to access the BEA report; however, a contributor to this thread (fdr) has apparently had access to at least portions of the report, and from his analyses, it seems that there were other factors at play in these incidents other than "improper pilot practices". For what ever reason, it seems that inadequate takeoff thrust was achieved during the subject events. The BEA report apparently doesn't cite this; however, the principal actions that have been taken are requiring the entering of reduced runway lengths into the flight computers, and, in the case of Air France, applying full power, reaching 50% of thrust while on brakes. These have been significant changes in procedures, which, in my opinion, seems to lift most, if not all, of the responsibility from the flight crews. As cited in Post #16 of this thread, recommended rates of rotation are being re-assessed. I think that Airbus'' performance data for certain aspects of the 340 operations require some looking into.
Anyway, just my opinion.
Cheers,
Grog
Anyway, just my opinion.
Cheers,
Grog
Join Date: Mar 2019
Location: Canada
Posts: 72
Likes: 0
Received 0 Likes
on
0 Posts
I don't know... the engineering calculations and simulations were actually prepared by Airbus, then reviewed by experts from BEA, Air France, and Lufthansa. Furthermore, since Air France & Lufthansa actually implemented operational changes, presumably the analysis was also reviewed by the union safety rep pilots.
But what do they know, they should have just consulted pprune experts who got to the actual root cause even without any access to the data.
But what do they know, they should have just consulted pprune experts who got to the actual root cause even without any access to the data.
ici l'rapport...
https://www.bea.aero/uploads/tx_elyd...A2017-0148.pdf
bon chance. Pour votre plaisir de lecture. Peut-�tre est-il correct, ou non, qui peut dire. La courbure de la terre est une bonne chose pour le d�collage de l'avion.
https://www.bea.aero/uploads/tx_elyd...A2017-0148.pdf
bon chance. Pour votre plaisir de lecture. Peut-�tre est-il correct, ou non, qui peut dire. La courbure de la terre est une bonne chose pour le d�collage de l'avion.