


Is the BOM manipulating temperature records?

How can RickNRoll assert what "didn't happen", without knowing what did happen.
Rick obviously purports to be precisely the person you describe: A BOM 'insider'.
I should note that I'm not alleging (and haven't alleged) 'manipulation' of data for inappropriate purposes. I'm merely interested in getting an insight into why the delta between aviation forecasts and reality seems to be getting larger.
These days I breathe a sigh of relief when I read "severe turbulence" in a forecast, as the ride almost invariably turns out smooth.
Not so welcome are all the announcements that Centre has to make about amended area forecasts being available. They seem to be increasing. It's almost as if there's some magic beans software that produces ARFORS on Saturday afternoon/evening, all of which have to be changed substantially when reality hits on Sunday morning.
Maybe I'm just perceiving these changes.
Last edited by Lead Balloon; 10th Aug 2017 at 03:28.

Join Date: Apr 2008
Location: Australia
Posts: 669
Likes: 0
Received 0 Likes
on
0 Posts
Why don't you ring up the bureau and ask them.
Jennifer Marohasy and Lance Pigeon have tried and tried to get satisfactory answers from the BOM on not just this incident, but a range of questions relating to their temperature data handling.
They have not got satisfactory answers yet.
Join Date: Apr 2008
Location: Australia
Posts: 669
Likes: 0
Received 0 Likes
on
0 Posts
What is hilarious, Duff Man, is your waltzing into this discussion and naively believing it is all about one reading. Do you realise just how ignorant you look?
Rutherglen, Victoria. Remember that name. This is the place where the questionable methodologies of the BOM are at their most apparent.
The BOM do something called "homogenisation" to all the recorded temperature readings. The temperature record then holds "homogenised" readings that are nothing like what was recorded on the ground at the time.
Yes, that's right - the temperature record is no longer a series of raw data readings, but a set of "homogenised" values.
Look at this:
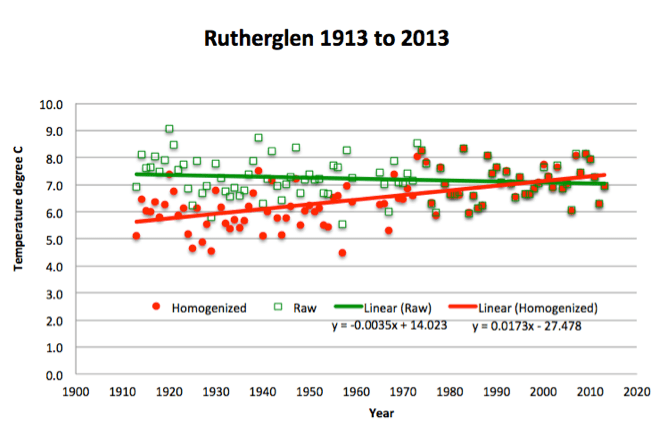
What you see is 100 years of Rutherglen's temperature data. The raw readings (green) and the "homogenised" (red). The BOM do not dispute this data or any of the readings. Does anything look fishy to you?
That graph was taken from this page. Take a look:
Rutherglen - Jennifer Marohasy
While you're there, look at this. More background on other places around Australia where a clear cooling trend, thanks to "homogenisation", has been turned into a warming trend:
https://ipa.org.au/wp-content/upload...Rutherglen.pdf
Rutherglen, Victoria. Remember that name. This is the place where the questionable methodologies of the BOM are at their most apparent.
The BOM do something called "homogenisation" to all the recorded temperature readings. The temperature record then holds "homogenised" readings that are nothing like what was recorded on the ground at the time.
Yes, that's right - the temperature record is no longer a series of raw data readings, but a set of "homogenised" values.
Look at this:
What you see is 100 years of Rutherglen's temperature data. The raw readings (green) and the "homogenised" (red). The BOM do not dispute this data or any of the readings. Does anything look fishy to you?
That graph was taken from this page. Take a look:
Rutherglen - Jennifer Marohasy
While you're there, look at this. More background on other places around Australia where a clear cooling trend, thanks to "homogenisation", has been turned into a warming trend:
https://ipa.org.au/wp-content/upload...Rutherglen.pdf
Yes bolthead: The person who recorded the lowest temp ever recorded at YGLB knows.
It's -8.5 according to this website: Goulburn historical averages, records and extremes But the website says it only covers from 1971 onwards. And it does not say what source it uses for the data.
I recorded -2 F in 1967 using a wall thermometer I purchased on the advice of Joe the Gadget Man, so I guess it's -18.889 C unless someone else has recorded a lower temperature.
Join Date: Apr 2008
Location: Australia
Posts: 669
Likes: 0
Received 0 Likes
on
0 Posts
One data point does not a trend make.
I'm referring to the single data point of Goulburn - Marohasy and the IPA are looking at the trend lines of the homogenised data and raw data from one location as if it's significant. Presumably with the intent of using it to discredit the BOM and saying they're manipulating data to support the pro-AGW case.
The temperature trend for a single location says absolutely nothing other than what is happening locally so is of zero significance taken in a wider context.
The temperature trend for a single location says absolutely nothing other than what is happening locally so is of zero significance taken in a wider context.
So why "homogenise" it?
One data point...how many GRIB blocks make up the upper wind forecast? What BOM is doing is "Homogenise" key data sites with long recording history. They then use these sites to adjust across the country to show a warming trend across the entire database. Effectively, BOM will reduce the key temp data to a handful of data points to represent the entire continent. Why one site? Why ANY site? Any thinking person must ask, critically, is the temperature record now trustworthy?
So how did BOM or anyone else work out the existence and extent of the non-climate related impacts on the temperatures recorded in Rutherglen Victoria in the early 1900s?
Join Date: Apr 2008
Location: Australia
Posts: 669
Likes: 0
Received 0 Likes
on
0 Posts
To account for non climate related impacts on the recorded temperatures.
None.
This is why that site is in such sharp focus. Unlike most other sites, it has never been moved. Also unlike most other sites, it has never had an encroachment of urbanisation on it.
So why the warming trend at Rutherglen when the raw data - which would have to be one of the most pristine temperature records in Australia - shows a cooling trend?
So what "non climate related impacts" have there been on the Rutherglen site, RickNRoll?
None.
This is why that site is in such sharp focus. Unlike most other sites, it has never been moved. Also unlike most other sites, it has never had an encroachment of urbanisation on it.
So why the warming trend at Rutherglen when the raw data - which would have to be one of the most pristine temperature records in Australia - shows a cooling trend?
Climate Data Online
Also, what we know of the history of this site. As AGW was not an issue back then, the importance of tracking all changes and impacts on temperature records were not relevant back then.
Rutherglen weather station
Mmmm ... Thats the very definition of Pristine ... you know ... "in its original condition; unspoilt."
Perfect, would be if there was no break in the data
Anyway, I don't think it's AGW that's made people pay attention, rather it's CAGW. Without the "C" its not worth a bucket of warm spit (with apologies to John Nance Garner).
I think you'll find that people knew the importance of collecting data on temperature, it just that there weren't trillions at stake for the prophets and acolytes of the 21st century's new religion
The phrase "correcting a statistically determined artificial jump in the data" used in BOM's explanation for the "homogeneity adustments" to the Rutherglen recordings is one of the starkest examples of circular self-justification I've read for long time.
And I'm someone who accepts a causal link between climate change and human activity.
It's no wonder the conspiracy theorists jump on this kind of nonsense. "Statistically determined" just means the output of a model based on someone's assumptions based on opinion. The extent of the "correction" will have been based on someone's opinion.
Another completely circular self-justification: "As AGW was not an issue back then, the importance of tracking all changes and impacts on temperature records were not relevant back then."
We have come to the conclusion that there is AGW. We do that on the basis of records. But some of those records have an "artificial jump" which we found as a consequence of a statistical model. We therefore have to "correct" those records. The "errors" were there because the people who made the records did not know about AGW. Once "corrected", the records support the conclusion that there is AGW.
Join Date: Aug 2007
Location: Melbourne
Age: 72
Posts: 774
Likes: 0
Received 0 Likes
on
0 Posts
Is there any point to this thread?
The OP posted;
The Golbourn AWOS reports the real time temp of say -10.5 deg C. I see it sitting at my desk. several days later i look at the temperature records and see that the lowest temp on that day has been adjusted to something like -9.0.
These were made up examples, not actual readings which have lead to over six pages and over one hundred posts for a fictitious 1.5 degrees.
You're not compelled to read it, you know.

