


Heathrow-2

Thread Starter
Heathrow conceals latest environmental performance stats
Heathrow last week "published" the latest quarter's results (Q3 2018) from its flagship Fly Quiet & Green environmental programme.
Or, rather, it didn't:
It appears that Heathrow's response to repeated accusations that the FQ&G results are deeply flawed is simply to conceal them from public view for long enough, presumably, for its PR machine to circulate the fiction to editors around the industry before the results are exposed to public scrutiny and the whole house of cards comes tumbling down.
Based on previous quarters' results we can fully expect that, if and when the Q3 results are finally made public, Heathrow will be found to have inflated airlines' scores to typically around 40% more than their environmental performance would merit if it had actually followed the methodology that it claims to be using.
Jolly poor show, chaps.

How do they get away with this nonsense?
Where are investigating journalists when you need them??
Where are investigating journalists when you need them??
Join Date: Mar 2009
Location: Eas Anglia
Age: 64
Posts: 812
Likes: 0
Received 0 Likes
on
0 Posts
https://www.thetimes.co.uk/article/heathrow-playing-numbers-game-lxgrrbv0r
I cannot for the life of me understand why all these doubters including an exasperated CAA don't come on here. Plenty here seem to have all the answers !
it's not just the noise they are concealing!
I cannot for the life of me understand why all these doubters including an exasperated CAA don't come on here. Plenty here seem to have all the answers !
it's not just the noise they are concealing!

They were still fixing the figures to cover the cost of R3 and FQ&G when the lights went out, and they realised they had not paid the electricity account.  If the CAA cannot understand HAL accounts and funding, they will when it all goes wrong and HMG has to pick up the bills for R3
If the CAA cannot understand HAL accounts and funding, they will when it all goes wrong and HMG has to pick up the bills for R3
when it all goes wrong and HMG has to pick up the bills for R3

Thread Starter
Thread Starter
Latest creative accounting by Heathrow
After more than two weeks hidden from the public, Heathrow has now published the results from its Fly Quiet & Green programme for 2018 Q3.
Unfortunately it seems determined to persist with the flaky arithmetic and absence of logic and common sense that characterised the results for previous quarters (which remain unaltered).
For Q3, as with previous quarters, league table scores have again been inflated, this time by a record 45% compared to the results that are produced when Heathrow's own published methodology and performance rankings are used. Once again that increase has not been applied uniformly across all 50 airlines (some of the poorer performing carriers have been awarded more than double the number of points that they merit), with the result that the relative league table positions are significantly altered.
Among the many anomalies in the Q3 results are:
a Individual airline scores are inflated by between 17% and 138%, with the poorest performing carriers receiving the biggest unjustified increase in their score. The lowest score awarded by Heathrow, 465 points, is over 200 points more than the airline in question actually merits based on its performance.
b Emirates and (again) Cathay Pacific are given an unexplained hike up the table (by 16 and 14 places respectively).
c Airlines entitled to feel aggrieved with this quarter's published results include Kuwait Airways, relegated 16 places from its rightful position, together with Qantas, also robbed (again) of 16 places. Qantas, despite meriting 470 points by Heathrow's own methodology, putting it just above Eurowings, bizarrely ends up 14 places below the German carrier.
d "RAG" (red/amber/green) classifications are again applied inconsistently; for example El Al and Ethiopian Airlines, ranked 47th and 48th, respectively, by Heathrow for early/late movements, get an "Amber" for that category while Delta and Aer Lingus, ranked 31st and 32nd for that metric by Heathrow, both get a "Red". Go figure.
e A total of 182 flights by Finnair's A350 fleet appear not to have been taken into account in calculating the results, with only its narrow-body flights having been counted.
Q3 2018
Thread Starter
For a description of the methodology that's supposedly being followed (but isn't), see: Fly Quiet & Green - How We Calculate
Heathrow's rules can be summarised as follows:
Airlines gain a maximum aggregate score of 1,000 Fly Quiet & Green points by being in first place for every metric.
An airline in last (50th) place for any metric scores 0 points for that metric (so if a hapless airline was in last place for every metric, it would score zero points out of 1,000).
Overall league table scores are the aggregate of an airline's place-related scores for each of the seven metrics.
A weighting schema (as described in the link) determines the maximum points available for the different metrics - for CDA violations first place merits 268 points, first place for NOx emissions gets 89 points, etc.
If we apply Heathrow's own rules to its reported results for Oman Air, for example:
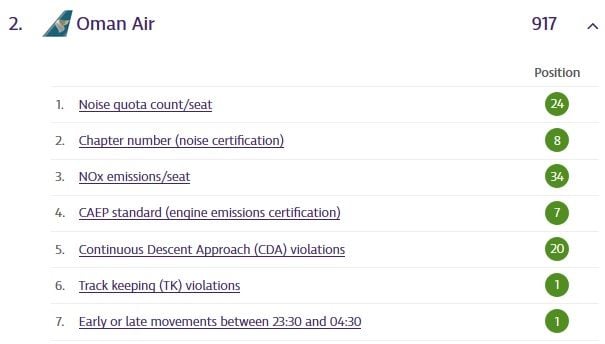
Heathrow ranks Oman Air 20th (out of 50 airlines) for CDA violations, and so the carrier forfeits 104 of the 268 available points for that one metric alone, thereby scoring 164 points for CDAs. Likewise another 60 points are deducted from a perfect score of 89 for its 34th place for NOx emissions, etc
So based on the 164 points deducted for those two metrics alone, Oman Air can't possibly merit an aggregate score awarded by Heathrow of 917 out of 1,000 !
In fact based on Heathrow's positions (see above) for all 7 metrics (including also 24th out of 50 for Noise quota count per seat), Oman Air forfeits a total of 230 points from a perfect 1,000 score, thereby achieving 770 points not 917.
Join Date: Dec 1999
Location: LHR/EGLL
Age: 45
Posts: 4,392
Likes: 0
Received 0 Likes
on
0 Posts
Sorry, I thought when you said data you meant the NTK and emissions databases that the airport uses.
Are you just looking at what points you think each airline has in each category, then adding them up and coming up with a different aggregate? It says individual metric scores are not published, so you�re assuming these scores?
Do you know it�s a pro rata points scheme though? I might have missed it, but I couldn�t see that described on the site
Thread Starter
All best answered from the previous link.
No, no assumptions are being made.
As Heathrow's explanation of the metrics does indeed make clear "Individual metric scores will not be published". That's to say we can't tell how well or badly an individual airline has performed against specific benchmarks (other than the coarse red/amber/green classification bands).
The only thing we can be sure of is whether Airline X was better/worse than Airline Y for any given metric, for example in the above stats for Oman Air we can tell that 19 airlines performed better than it did on CDAs (but not how much better).
But relative rankings are the basis on which Heathrow says it has derived the "league table" points, so the published rankings are all the information we need in order to be able to check the validity of its results.
Incidentally, since the scores are relative and not absolute, we can't tell either whether an airline has actually improved its performance quarter-on-quarter - all we can know is whether the number of other airlines better/worse than it has gone up or down since the previous quarter (but that's a different issue).
The points values for first and last place are unambiguously defined and "The final score for each airline is calculated by adding up combinations of an airline’s ranking position for each individual metric and the weighting set for the given metric" strongly implies a direct linear relationship between places lost and points lost so that, for example, an airline halfway down the rankings for a given metric gets half the available points, and so on.
Besides, I can't think of any way that even a grossly skewed (and disingenuously undocumented) "points losts per place" sliding scale would produce the published results, with individual airline aggregate scores inflated by between +17% and +138%.
As the saying goes, if it sounds too good to be true ...
Sorry, I thought when you said data you meant the NTK and emissions databases that the airport uses.
Are you just looking at what points you think each airline has in each category, then adding them up and coming up with a different aggregate? It says individual metric scores are not published, so you’re assuming these scores?
Are you just looking at what points you think each airline has in each category, then adding them up and coming up with a different aggregate? It says individual metric scores are not published, so you’re assuming these scores?
As Heathrow's explanation of the metrics does indeed make clear "Individual metric scores will not be published". That's to say we can't tell how well or badly an individual airline has performed against specific benchmarks (other than the coarse red/amber/green classification bands).
The only thing we can be sure of is whether Airline X was better/worse than Airline Y for any given metric, for example in the above stats for Oman Air we can tell that 19 airlines performed better than it did on CDAs (but not how much better).
But relative rankings are the basis on which Heathrow says it has derived the "league table" points, so the published rankings are all the information we need in order to be able to check the validity of its results.
Incidentally, since the scores are relative and not absolute, we can't tell either whether an airline has actually improved its performance quarter-on-quarter - all we can know is whether the number of other airlines better/worse than it has gone up or down since the previous quarter (but that's a different issue).
Do you know it’s a pro rata points scheme though? I might have missed it, but I couldn’t see that described on the site
Besides, I can't think of any way that even a grossly skewed (and disingenuously undocumented) "points losts per place" sliding scale would produce the published results, with individual airline aggregate scores inflated by between +17% and +138%.
As the saying goes, if it sounds too good to be true ...
Join Date: Nov 2014
Location: London
Posts: 490
Likes: 0
Received 0 Likes
on
0 Posts
How easy would it be for easyJet to operate the Flybe slots to and from ABZ/EDI if Flybe decide to give them up. Recent analysis shows that LHR routes are not doing well for Flybe. No surprise given lack of network synergy/code-share partners and the high cost per seat of a Q400 into LHR.
Join Date: Nov 2004
Location: scotland
Posts: 760
Likes: 0
Received 0 Likes
on
0 Posts
How easy would it be for easyJet to operate the Flybe slots to and from ABZ/EDI if Flybe decide to give them up. Recent analysis shows that LHR routes are not doing well for Flybe. No surprise given lack of network synergy/code-share partners and the high cost per seat of a Q400 into LHR.
Thread Starter
Time based separation increases capacity by 1.4 landings at Heathrow
Per hour, in case anyone was wondering. 
International Airport Review: Time based separation increases capacity by 1.4 landings at Heathrow
International Airport Review: Time based separation increases capacity by 1.4 landings at Heathrow
Thread Starter
The CAA publishes traffic statistics for UK domestic routes, with the most recent (for September) showing LHR/EDI 103K and LHR/ABZ 58K.
But of course that's the total of BA+BE. On routes with more than one carrier the shares are never published, so I'd be equally interested to know where any Flybe figures have come from.
But of course that's the total of BA+BE. On routes with more than one carrier the shares are never published, so I'd be equally interested to know where any Flybe figures have come from.