Originally Posted by
20driver
Originally Posted by
Ian W 
There are two things to be concerned about with graphs
watch what is being done with the Y axis normally this exhibits a degree (cough) of precision in temperature measurement that would not be achieved by the
accuracy of a met observer in howling sleet reading a temperature from a thermometer in a Stevenson Screen. The comparisons with 'global temperatures' from the past when in the Southern hemisphere a hundred years ago there were very very few observations - are extremely shaky as the much of the temperatures are based on guesswork but then expressed with a precision of hundredths of a degree
(ever seen error bars on those graphs? No nor have I),
This encapsulates is so much of my objection to the current state climate science. The rules of evaluating and presenting data in a manner that accounts for precision do not apply.
This NASA GISS graph is what is normally shown in all the 'climate emergency' media reports note that the display is in 10ths of a degree centigrade for a 'global mean
estimates on land and ocean data'. In 1880 there would be less than 100 observer thermometers in the entire Southern Hemisphere most of those in Australia. Some sea temperatures would be being taken by a disinterested boat crew using a canvas bucket dunked into the sea and a handheld thermometer. Even in the Northern Hemisphere before the 1940's it is unlikely that there was any precision in meteorological observations. It is only relatively recently that rules were applied internationally for rounding up or down to the nearest degree. Yet this inaccurate data is averaged (The 'average' is built from a daily 'average' which is actually the mean of the highest and lowest temperature. So if the lower temperatures have not been as low - this will be claimed as warming.) Comparing observations at hourly intervals by a bored meteorological observer to the recent automated observation systems that record transients of a few seconds is a statistical nonsense due to change in sampling rates. (The Heathrow automated observation system just North of the Northern runway at the express exit where it sits in jetwash much of the time. ) The error bars on the Y axis below would probably be +/- a degree - or outside the graph. Note that this is an 'anomaly' metric so is based on how much warmer than the standard temperature of the Earth the temperature is - and that is a whole different argument.
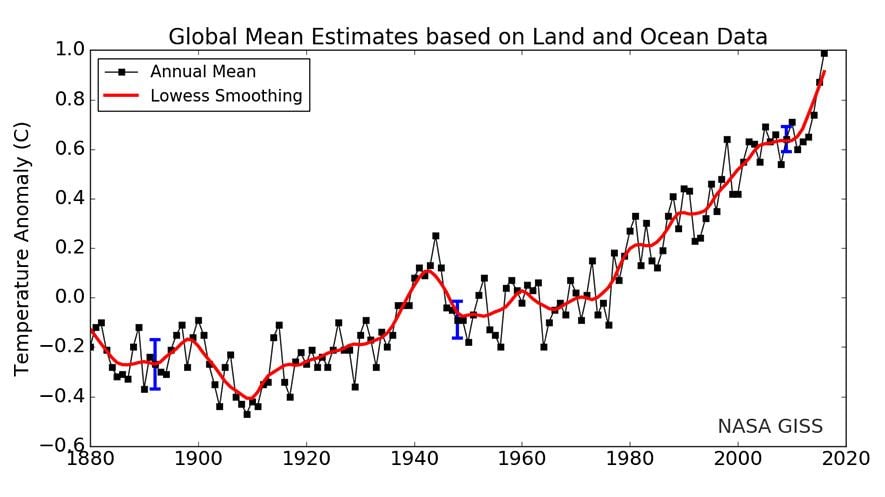
You will see why those who want to report a crisis prefer to stretch the Y axis and show unreal precision reporting a very inaccurate input especially values reported before 1940. As said much of the southern hemisphere is 'estimated'. [or to be blunt " In [url=https://realclimatescience.com/2015/12/southern-hemisphere-temperature-fraud/]Climategate E-Mails, Phil Jones admitted that much of his southern hemisphere temperatures were made up, because there is no actual data. "]
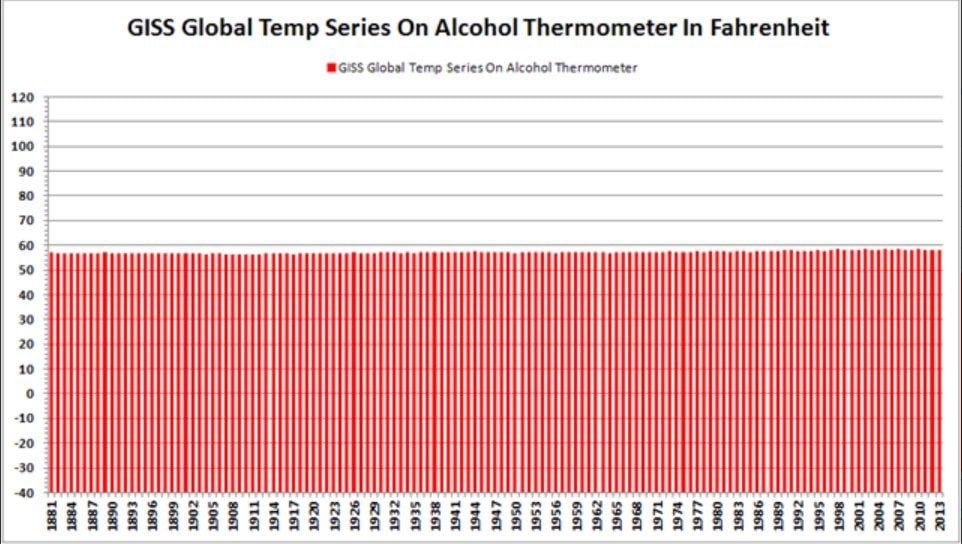
So should we panic? Well below are the global average land/ocean temperature series shown by a line of red-alcohol thermometers.
There's a lot more such as disregard of atmospheric enthalpy, but you are probably bored already.